Immigrants from Eastern Africa vs Assyrian/Chaldean/Syriac Family Poverty
COMPARE
Immigrants from Eastern Africa
Assyrian/Chaldean/Syriac
Family Poverty
Family Poverty Comparison
Immigrants from Eastern Africa
Assyrians/Chaldeans/Syriacs
9.5%
FAMILY POVERTY
15.1/ 100
METRIC RATING
208th/ 347
METRIC RANK
7.3%
FAMILY POVERTY
99.7/ 100
METRIC RATING
23rd/ 347
METRIC RANK
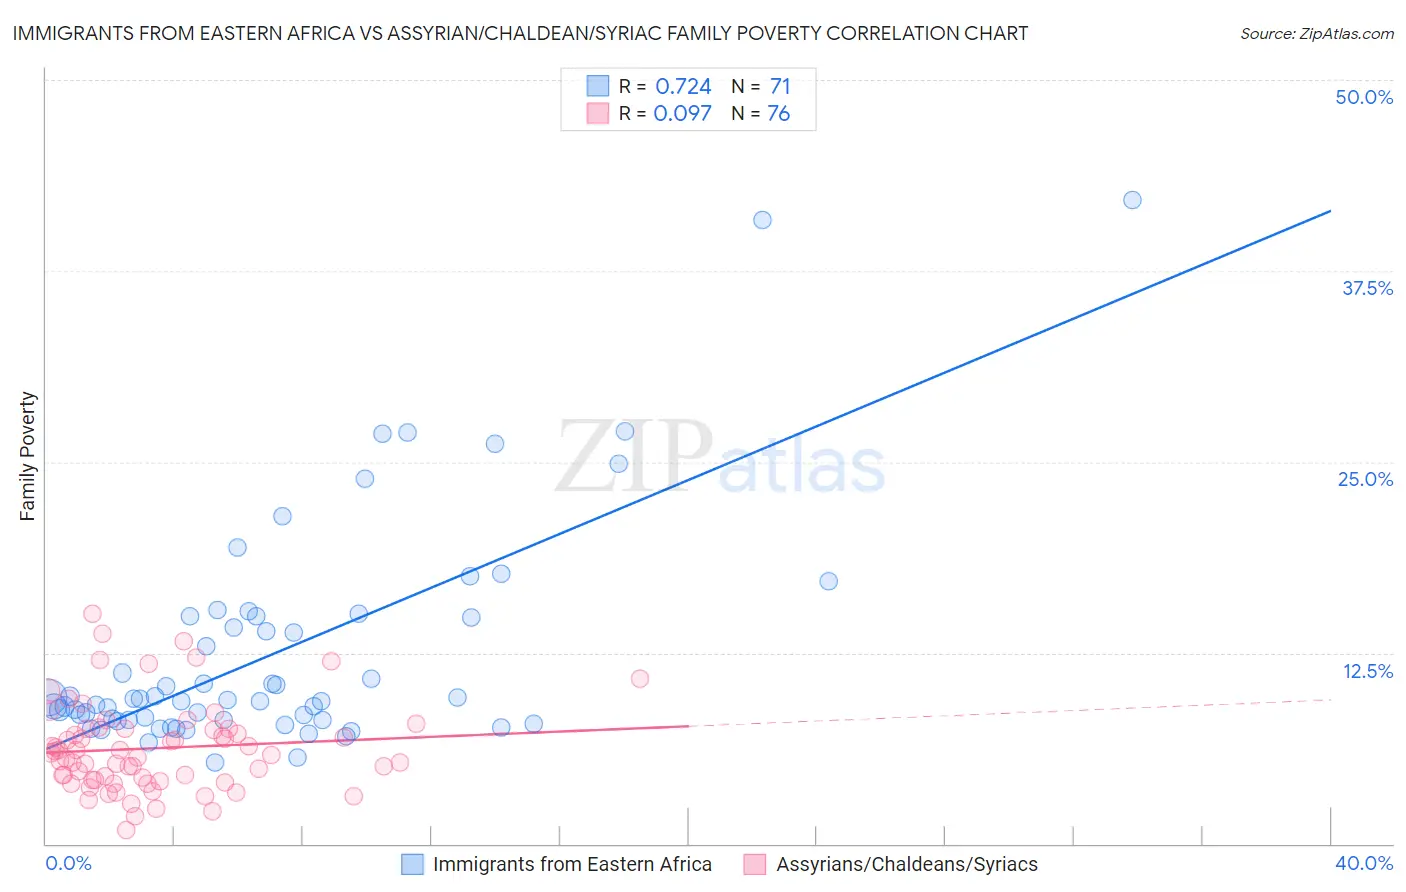
Immigrants from Eastern Africa vs Assyrian/Chaldean/Syriac Family Poverty Correlation Chart
The statistical analysis conducted on geographies consisting of 354,301,294 people shows a strong positive correlation between the proportion of Immigrants from Eastern Africa and poverty level among families in the United States with a correlation coefficient (R) of 0.724 and weighted average of 9.5%. Similarly, the statistical analysis conducted on geographies consisting of 110,238,893 people shows a slight positive correlation between the proportion of Assyrians/Chaldeans/Syriacs and poverty level among families in the United States with a correlation coefficient (R) of 0.097 and weighted average of 7.3%, a difference of 30.3%.
Family Poverty Correlation Summary
| Measurement | Immigrants from Eastern Africa | Assyrian/Chaldean/Syriac |
| Minimum | 5.3% | 0.89% |
| Maximum | 42.2% | 15.1% |
| Range | 36.8% | 14.2% |
| Mean | 12.5% | 6.3% |
| Median | 9.4% | 5.9% |
| Interquartile 25% (IQ1) | 8.1% | 4.2% |
| Interquartile 75% (IQ3) | 14.9% | 7.5% |
| Interquartile Range (IQR) | 6.7% | 3.3% |
| Standard Deviation (Sample) | 7.4% | 2.9% |
| Standard Deviation (Population) | 7.4% | 2.9% |
Similar Demographics by Family Poverty
Demographics Similar to Immigrants from Eastern Africa by Family Poverty
In terms of family poverty, the demographic groups most similar to Immigrants from Eastern Africa are Sierra Leonean (9.5%, a difference of 0.11%), Immigrants from Uruguay (9.5%, a difference of 0.29%), Immigrants from South America (9.5%, a difference of 0.64%), Aleut (9.5%, a difference of 0.65%), and Immigrants from Lebanon (9.4%, a difference of 0.84%).
| Demographics | Rating | Rank | Family Poverty |
| Immigrants | Portugal | 20.5 /100 | #201 | Fair 9.4% |
| Immigrants | Sierra Leone | 19.6 /100 | #202 | Poor 9.4% |
| German Russians | 19.4 /100 | #203 | Poor 9.4% |
| Immigrants | Lebanon | 18.9 /100 | #204 | Poor 9.4% |
| Aleuts | 18.0 /100 | #205 | Poor 9.5% |
| Immigrants | South America | 18.0 /100 | #206 | Poor 9.5% |
| Sierra Leoneans | 15.6 /100 | #207 | Poor 9.5% |
| Immigrants | Eastern Africa | 15.1 /100 | #208 | Poor 9.5% |
| Immigrants | Uruguay | 14.0 /100 | #209 | Poor 9.5% |
| Alsatians | 11.3 /100 | #210 | Poor 9.6% |
| Malaysians | 10.6 /100 | #211 | Poor 9.6% |
| Immigrants | Thailand | 9.7 /100 | #212 | Tragic 9.7% |
| Osage | 8.0 /100 | #213 | Tragic 9.7% |
| Immigrants | Micronesia | 6.7 /100 | #214 | Tragic 9.8% |
| Immigrants | Nonimmigrants | 6.7 /100 | #215 | Tragic 9.8% |
Demographics Similar to Assyrians/Chaldeans/Syriacs by Family Poverty
In terms of family poverty, the demographic groups most similar to Assyrians/Chaldeans/Syriacs are Danish (7.3%, a difference of 0.010%), Croatian (7.3%, a difference of 0.30%), Burmese (7.3%, a difference of 0.30%), Immigrants from Iran (7.3%, a difference of 0.45%), and Cypriot (7.3%, a difference of 0.55%).
| Demographics | Rating | Rank | Family Poverty |
| Immigrants | South Central Asia | 99.8 /100 | #16 | Exceptional 7.2% |
| Luxembourgers | 99.8 /100 | #17 | Exceptional 7.2% |
| Immigrants | Lithuania | 99.8 /100 | #18 | Exceptional 7.2% |
| Eastern Europeans | 99.7 /100 | #19 | Exceptional 7.2% |
| Immigrants | Hong Kong | 99.7 /100 | #20 | Exceptional 7.3% |
| Immigrants | Iran | 99.7 /100 | #21 | Exceptional 7.3% |
| Danes | 99.7 /100 | #22 | Exceptional 7.3% |
| Assyrians/Chaldeans/Syriacs | 99.7 /100 | #23 | Exceptional 7.3% |
| Croatians | 99.7 /100 | #24 | Exceptional 7.3% |
| Burmese | 99.7 /100 | #25 | Exceptional 7.3% |
| Cypriots | 99.6 /100 | #26 | Exceptional 7.3% |
| Immigrants | Scotland | 99.6 /100 | #27 | Exceptional 7.3% |
| Immigrants | Korea | 99.6 /100 | #28 | Exceptional 7.4% |
| Immigrants | Northern Europe | 99.6 /100 | #29 | Exceptional 7.4% |
| Italians | 99.6 /100 | #30 | Exceptional 7.4% |