Immigrants from Eastern Europe vs Laotian Female Poverty Among 18-24 Year Olds
COMPARE
Immigrants from Eastern Europe
Laotian
Female Poverty Among 18-24 Year Olds
Female Poverty Among 18-24 Year Olds Comparison
Immigrants from Eastern Europe
Laotians
18.2%
FEMALE POVERTY AMONG 18-24 YEAR OLDS
99.9/ 100
METRIC RATING
51st/ 347
METRIC RANK
19.2%
FEMALE POVERTY AMONG 18-24 YEAR OLDS
97.1/ 100
METRIC RATING
110th/ 347
METRIC RANK
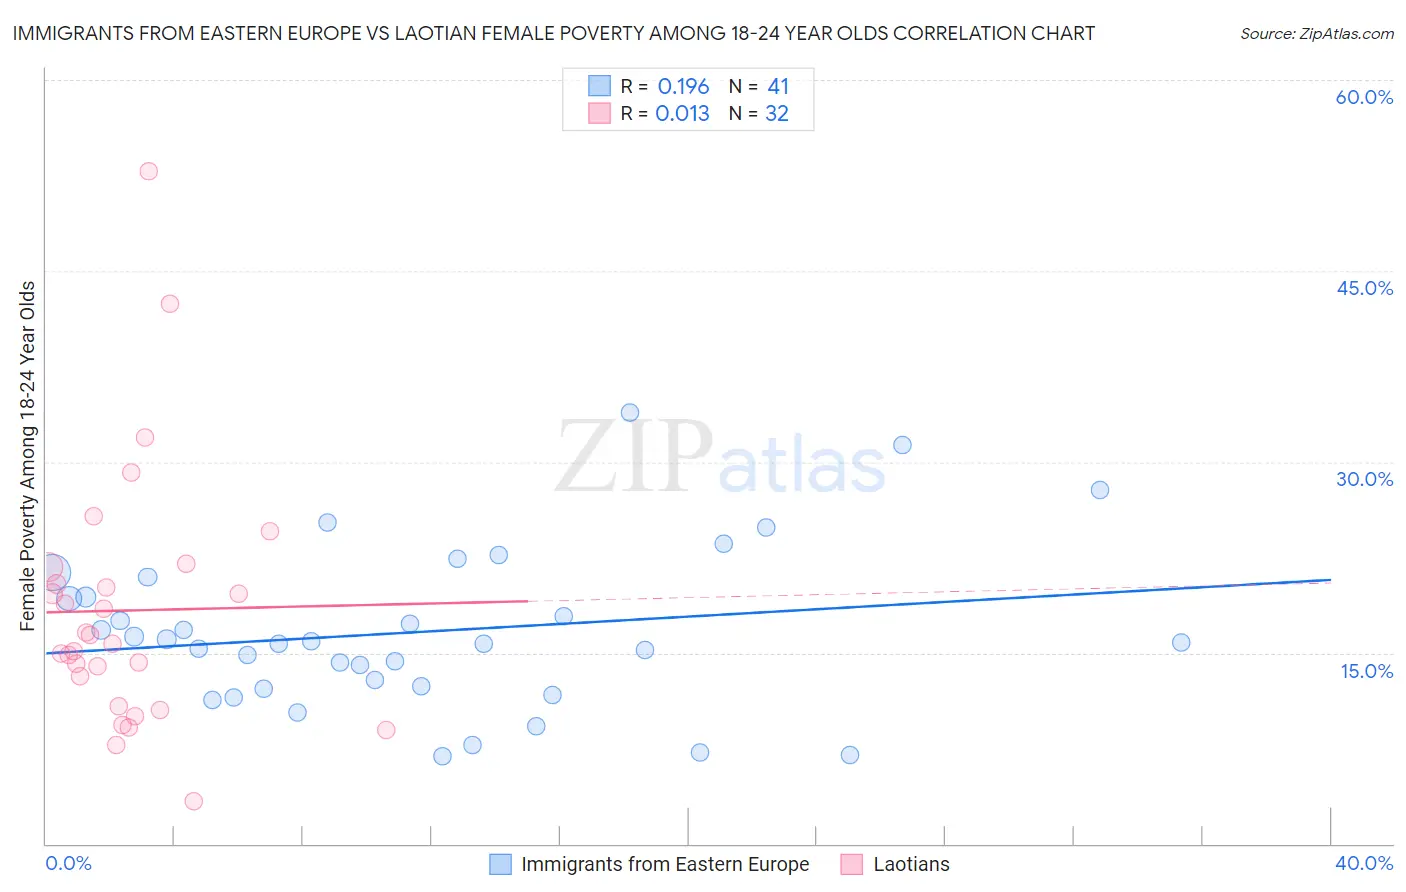
Immigrants from Eastern Europe vs Laotian Female Poverty Among 18-24 Year Olds Correlation Chart
The statistical analysis conducted on geographies consisting of 457,147,283 people shows a poor positive correlation between the proportion of Immigrants from Eastern Europe and poverty level among females between the ages 18 and 24 in the United States with a correlation coefficient (R) of 0.196 and weighted average of 18.2%. Similarly, the statistical analysis conducted on geographies consisting of 222,164,569 people shows no correlation between the proportion of Laotians and poverty level among females between the ages 18 and 24 in the United States with a correlation coefficient (R) of 0.013 and weighted average of 19.2%, a difference of 5.4%.
Female Poverty Among 18-24 Year Olds Correlation Summary
| Measurement | Immigrants from Eastern Europe | Laotian |
| Minimum | 6.9% | 3.3% |
| Maximum | 33.9% | 52.8% |
| Range | 27.0% | 49.5% |
| Mean | 16.6% | 18.3% |
| Median | 15.8% | 16.0% |
| Interquartile 25% (IQ1) | 12.3% | 12.0% |
| Interquartile 75% (IQ3) | 20.2% | 21.1% |
| Interquartile Range (IQR) | 7.9% | 9.1% |
| Standard Deviation (Sample) | 6.3% | 10.0% |
| Standard Deviation (Population) | 6.2% | 9.9% |
Similar Demographics by Female Poverty Among 18-24 Year Olds
Demographics Similar to Immigrants from Eastern Europe by Female Poverty Among 18-24 Year Olds
In terms of female poverty among 18-24 year olds, the demographic groups most similar to Immigrants from Eastern Europe are Samoan (18.2%, a difference of 0.17%), Bhutanese (18.2%, a difference of 0.28%), Sri Lankan (18.2%, a difference of 0.31%), Immigrants from Ireland (18.3%, a difference of 0.35%), and Asian (18.2%, a difference of 0.36%).
| Demographics | Rating | Rank | Female Poverty Among 18-24 Year Olds |
| Nicaraguans | 100.0 /100 | #44 | Exceptional 18.1% |
| Spanish American Indians | 100.0 /100 | #45 | Exceptional 18.1% |
| Immigrants | Southern Europe | 100.0 /100 | #46 | Exceptional 18.2% |
| Asians | 100.0 /100 | #47 | Exceptional 18.2% |
| Sri Lankans | 100.0 /100 | #48 | Exceptional 18.2% |
| Bhutanese | 100.0 /100 | #49 | Exceptional 18.2% |
| Samoans | 100.0 /100 | #50 | Exceptional 18.2% |
| Immigrants | Eastern Europe | 99.9 /100 | #51 | Exceptional 18.2% |
| Immigrants | Ireland | 99.9 /100 | #52 | Exceptional 18.3% |
| Italians | 99.9 /100 | #53 | Exceptional 18.3% |
| Immigrants | Egypt | 99.9 /100 | #54 | Exceptional 18.4% |
| Albanians | 99.9 /100 | #55 | Exceptional 18.4% |
| Argentineans | 99.9 /100 | #56 | Exceptional 18.4% |
| Immigrants | Italy | 99.9 /100 | #57 | Exceptional 18.4% |
| Immigrants | Ukraine | 99.9 /100 | #58 | Exceptional 18.4% |
Demographics Similar to Laotians by Female Poverty Among 18-24 Year Olds
In terms of female poverty among 18-24 year olds, the demographic groups most similar to Laotians are Immigrants from Serbia (19.2%, a difference of 0.020%), Immigrants from Syria (19.2%, a difference of 0.030%), Immigrants from Uzbekistan (19.2%, a difference of 0.11%), Immigrants from Sri Lanka (19.2%, a difference of 0.20%), and Immigrants from El Salvador (19.3%, a difference of 0.24%).
| Demographics | Rating | Rank | Female Poverty Among 18-24 Year Olds |
| Serbians | 98.0 /100 | #103 | Exceptional 19.1% |
| Immigrants | Afghanistan | 98.0 /100 | #104 | Exceptional 19.1% |
| Immigrants | Ecuador | 97.8 /100 | #105 | Exceptional 19.2% |
| Immigrants | Sierra Leone | 97.8 /100 | #106 | Exceptional 19.2% |
| Immigrants | Sri Lanka | 97.5 /100 | #107 | Exceptional 19.2% |
| Immigrants | Uzbekistan | 97.3 /100 | #108 | Exceptional 19.2% |
| Immigrants | Syria | 97.2 /100 | #109 | Exceptional 19.2% |
| Laotians | 97.1 /100 | #110 | Exceptional 19.2% |
| Immigrants | Serbia | 97.1 /100 | #111 | Exceptional 19.2% |
| Immigrants | El Salvador | 96.5 /100 | #112 | Exceptional 19.3% |
| Immigrants | Cameroon | 96.3 /100 | #113 | Exceptional 19.3% |
| Slovenes | 96.2 /100 | #114 | Exceptional 19.3% |
| Immigrants | Hungary | 96.2 /100 | #115 | Exceptional 19.3% |
| Immigrants | Immigrants | 95.9 /100 | #116 | Exceptional 19.3% |
| Immigrants | Iran | 95.8 /100 | #117 | Exceptional 19.3% |