Immigrants from Nepal vs Laotian Female Poverty Among 18-24 Year Olds
COMPARE
Immigrants from Nepal
Laotian
Female Poverty Among 18-24 Year Olds
Female Poverty Among 18-24 Year Olds Comparison
Immigrants from Nepal
Laotians
20.7%
FEMALE POVERTY AMONG 18-24 YEAR OLDS
9.6/ 100
METRIC RATING
218th/ 347
METRIC RANK
19.2%
FEMALE POVERTY AMONG 18-24 YEAR OLDS
97.1/ 100
METRIC RATING
110th/ 347
METRIC RANK
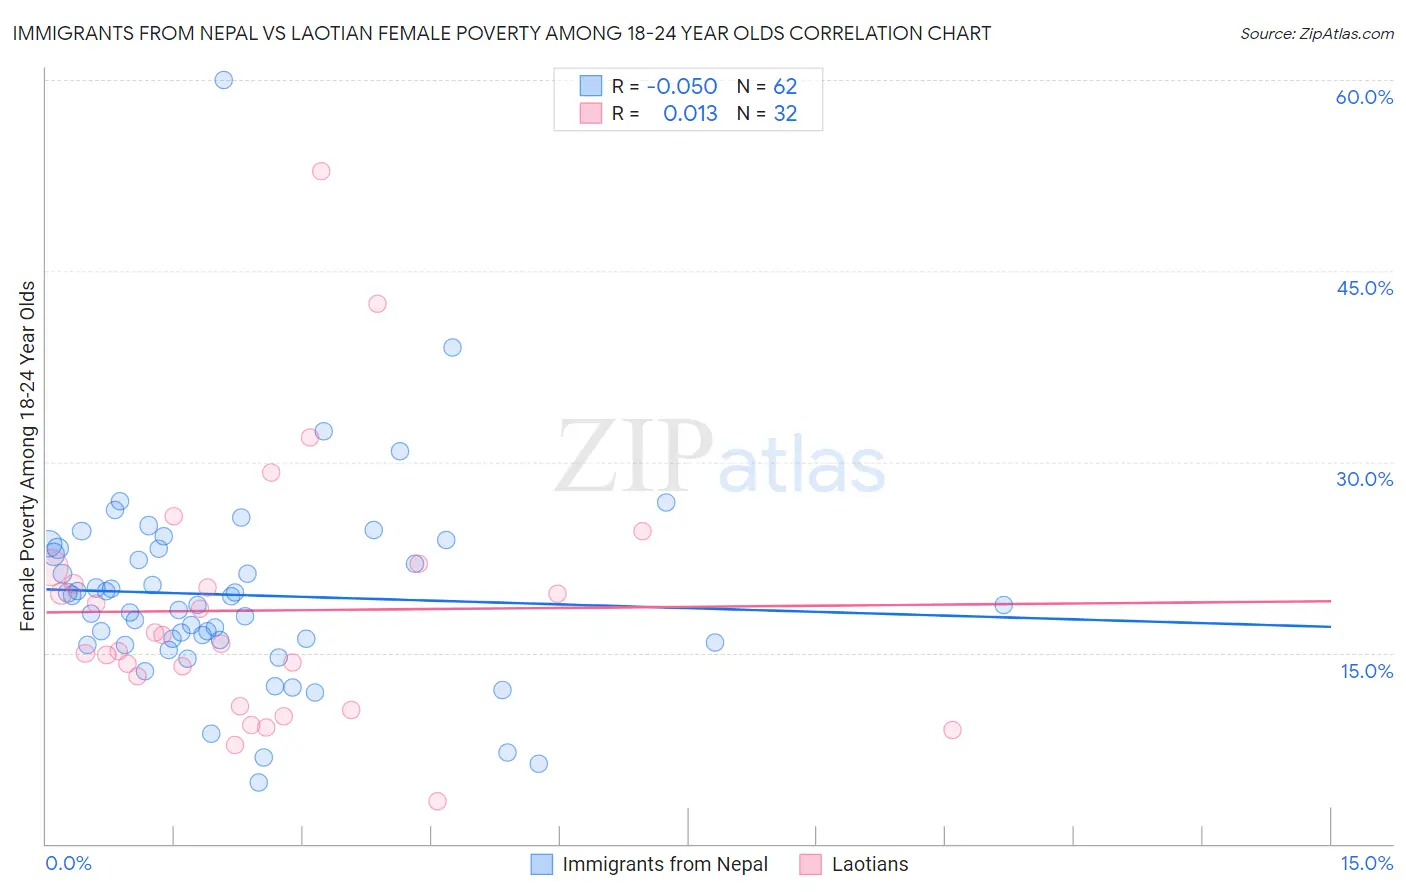
Immigrants from Nepal vs Laotian Female Poverty Among 18-24 Year Olds Correlation Chart
The statistical analysis conducted on geographies consisting of 184,918,180 people shows a slight negative correlation between the proportion of Immigrants from Nepal and poverty level among females between the ages 18 and 24 in the United States with a correlation coefficient (R) of -0.050 and weighted average of 20.7%. Similarly, the statistical analysis conducted on geographies consisting of 222,164,569 people shows no correlation between the proportion of Laotians and poverty level among females between the ages 18 and 24 in the United States with a correlation coefficient (R) of 0.013 and weighted average of 19.2%, a difference of 7.3%.
Female Poverty Among 18-24 Year Olds Correlation Summary
| Measurement | Immigrants from Nepal | Laotian |
| Minimum | 4.8% | 3.3% |
| Maximum | 60.0% | 52.8% |
| Range | 55.2% | 49.5% |
| Mean | 19.5% | 18.3% |
| Median | 18.8% | 16.0% |
| Interquartile 25% (IQ1) | 15.8% | 12.0% |
| Interquartile 75% (IQ3) | 23.1% | 21.1% |
| Interquartile Range (IQR) | 7.4% | 9.1% |
| Standard Deviation (Sample) | 8.1% | 10.0% |
| Standard Deviation (Population) | 8.0% | 9.9% |
Similar Demographics by Female Poverty Among 18-24 Year Olds
Demographics Similar to Immigrants from Nepal by Female Poverty Among 18-24 Year Olds
In terms of female poverty among 18-24 year olds, the demographic groups most similar to Immigrants from Nepal are Immigrants from Laos (20.6%, a difference of 0.010%), Immigrants from Micronesia (20.7%, a difference of 0.010%), British (20.7%, a difference of 0.030%), Immigrants from Western Africa (20.6%, a difference of 0.080%), and Spanish (20.6%, a difference of 0.10%).
| Demographics | Rating | Rank | Female Poverty Among 18-24 Year Olds |
| Immigrants | Western Europe | 13.5 /100 | #211 | Poor 20.6% |
| Liberians | 11.6 /100 | #212 | Poor 20.6% |
| Northern Europeans | 11.6 /100 | #213 | Poor 20.6% |
| Immigrants | South Africa | 10.7 /100 | #214 | Poor 20.6% |
| Spanish | 10.4 /100 | #215 | Poor 20.6% |
| Immigrants | Western Africa | 10.2 /100 | #216 | Poor 20.6% |
| Immigrants | Laos | 9.7 /100 | #217 | Tragic 20.6% |
| Immigrants | Nepal | 9.6 /100 | #218 | Tragic 20.7% |
| Immigrants | Micronesia | 9.6 /100 | #219 | Tragic 20.7% |
| British | 9.4 /100 | #220 | Tragic 20.7% |
| Barbadians | 9.0 /100 | #221 | Tragic 20.7% |
| Guatemalans | 8.1 /100 | #222 | Tragic 20.7% |
| French | 7.9 /100 | #223 | Tragic 20.7% |
| Immigrants | Liberia | 7.6 /100 | #224 | Tragic 20.7% |
| Norwegians | 7.3 /100 | #225 | Tragic 20.7% |
Demographics Similar to Laotians by Female Poverty Among 18-24 Year Olds
In terms of female poverty among 18-24 year olds, the demographic groups most similar to Laotians are Immigrants from Serbia (19.2%, a difference of 0.020%), Immigrants from Syria (19.2%, a difference of 0.030%), Immigrants from Uzbekistan (19.2%, a difference of 0.11%), Immigrants from Sri Lanka (19.2%, a difference of 0.20%), and Immigrants from El Salvador (19.3%, a difference of 0.24%).
| Demographics | Rating | Rank | Female Poverty Among 18-24 Year Olds |
| Serbians | 98.0 /100 | #103 | Exceptional 19.1% |
| Immigrants | Afghanistan | 98.0 /100 | #104 | Exceptional 19.1% |
| Immigrants | Ecuador | 97.8 /100 | #105 | Exceptional 19.2% |
| Immigrants | Sierra Leone | 97.8 /100 | #106 | Exceptional 19.2% |
| Immigrants | Sri Lanka | 97.5 /100 | #107 | Exceptional 19.2% |
| Immigrants | Uzbekistan | 97.3 /100 | #108 | Exceptional 19.2% |
| Immigrants | Syria | 97.2 /100 | #109 | Exceptional 19.2% |
| Laotians | 97.1 /100 | #110 | Exceptional 19.2% |
| Immigrants | Serbia | 97.1 /100 | #111 | Exceptional 19.2% |
| Immigrants | El Salvador | 96.5 /100 | #112 | Exceptional 19.3% |
| Immigrants | Cameroon | 96.3 /100 | #113 | Exceptional 19.3% |
| Slovenes | 96.2 /100 | #114 | Exceptional 19.3% |
| Immigrants | Hungary | 96.2 /100 | #115 | Exceptional 19.3% |
| Immigrants | Immigrants | 95.9 /100 | #116 | Exceptional 19.3% |
| Immigrants | Iran | 95.8 /100 | #117 | Exceptional 19.3% |