Immigrants from Afghanistan vs Bangladeshi Seniors Poverty Over the Age of 65
COMPARE
Immigrants from Afghanistan
Bangladeshi
Seniors Poverty Over the Age of 65
Seniors Poverty Over the Age of 65 Comparison
Immigrants from Afghanistan
Bangladeshis
10.1%
SENIORS POVERTY OVER THE AGE OF 65
97.2/ 100
METRIC RATING
84th/ 347
METRIC RANK
11.2%
SENIORS POVERTY OVER THE AGE OF 65
25.2/ 100
METRIC RATING
196th/ 347
METRIC RANK
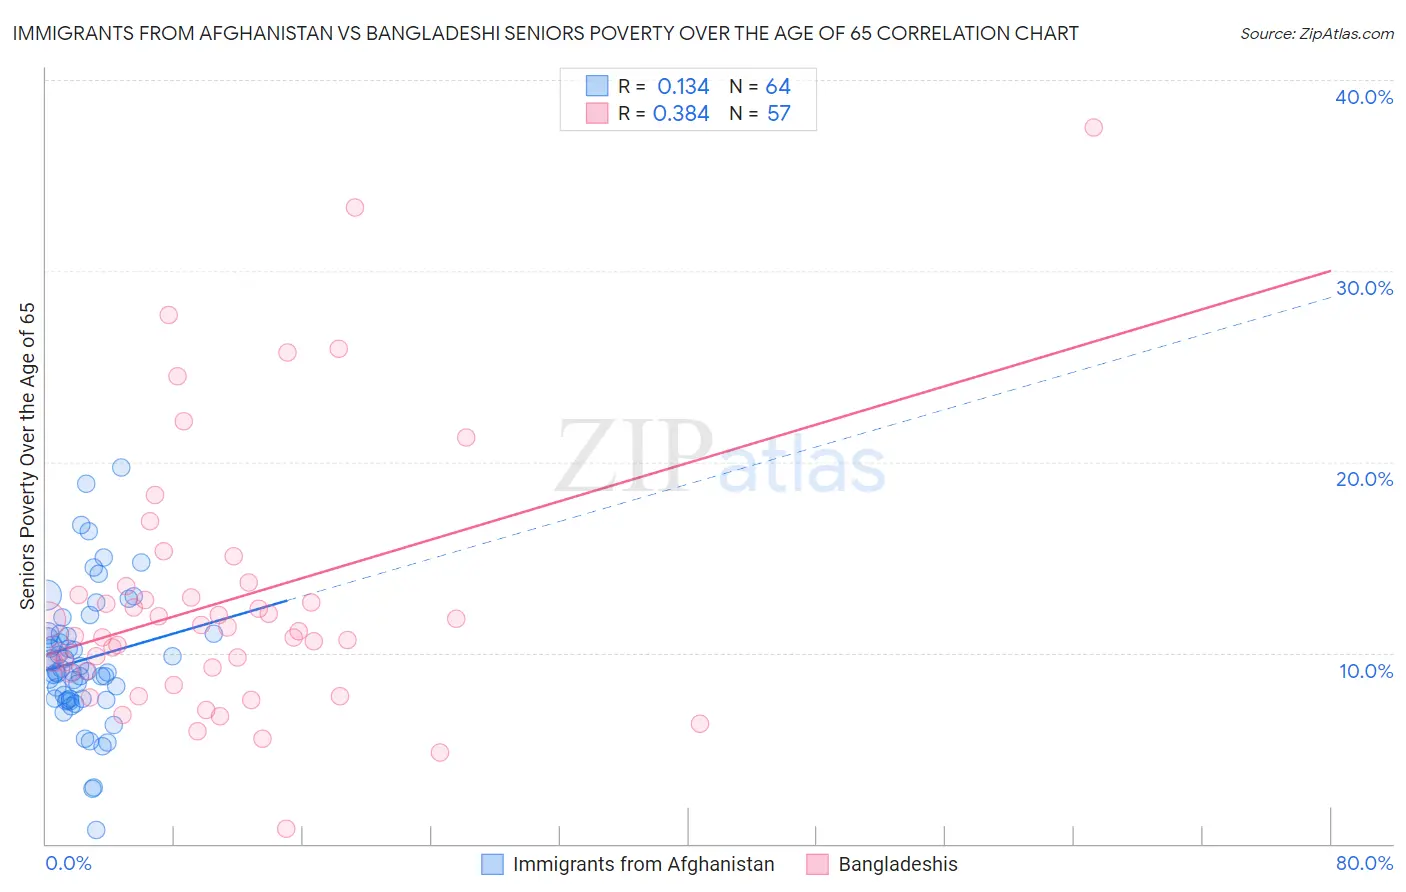
Immigrants from Afghanistan vs Bangladeshi Seniors Poverty Over the Age of 65 Correlation Chart
The statistical analysis conducted on geographies consisting of 147,505,027 people shows a poor positive correlation between the proportion of Immigrants from Afghanistan and poverty level among seniors over the age of 65 in the United States with a correlation coefficient (R) of 0.134 and weighted average of 10.1%. Similarly, the statistical analysis conducted on geographies consisting of 140,940,566 people shows a mild positive correlation between the proportion of Bangladeshis and poverty level among seniors over the age of 65 in the United States with a correlation coefficient (R) of 0.384 and weighted average of 11.2%, a difference of 11.2%.
Seniors Poverty Over the Age of 65 Correlation Summary
| Measurement | Immigrants from Afghanistan | Bangladeshi |
| Minimum | 0.71% | 0.78% |
| Maximum | 19.7% | 37.5% |
| Range | 19.0% | 36.7% |
| Mean | 9.6% | 12.7% |
| Median | 9.0% | 11.1% |
| Interquartile 25% (IQ1) | 7.6% | 9.0% |
| Interquartile 75% (IQ3) | 11.0% | 13.3% |
| Interquartile Range (IQR) | 3.4% | 4.3% |
| Standard Deviation (Sample) | 3.5% | 6.9% |
| Standard Deviation (Population) | 3.5% | 6.8% |
Similar Demographics by Seniors Poverty Over the Age of 65
Demographics Similar to Immigrants from Afghanistan by Seniors Poverty Over the Age of 65
In terms of seniors poverty over the age of 65, the demographic groups most similar to Immigrants from Afghanistan are Immigrants from Nepal (10.1%, a difference of 0.0%), Romanian (10.1%, a difference of 0.020%), Immigrants from Poland (10.1%, a difference of 0.030%), Burmese (10.1%, a difference of 0.040%), and Immigrants from Bolivia (10.1%, a difference of 0.050%).
| Demographics | Rating | Rank | Seniors Poverty Over the Age of 65 |
| Immigrants | South Africa | 97.7 /100 | #77 | Exceptional 10.0% |
| Whites/Caucasians | 97.5 /100 | #78 | Exceptional 10.0% |
| Immigrants | Ireland | 97.5 /100 | #79 | Exceptional 10.0% |
| Koreans | 97.4 /100 | #80 | Exceptional 10.1% |
| Immigrants | Sri Lanka | 97.3 /100 | #81 | Exceptional 10.1% |
| Immigrants | Bolivia | 97.3 /100 | #82 | Exceptional 10.1% |
| Immigrants | Poland | 97.2 /100 | #83 | Exceptional 10.1% |
| Immigrants | Afghanistan | 97.2 /100 | #84 | Exceptional 10.1% |
| Immigrants | Nepal | 97.2 /100 | #85 | Exceptional 10.1% |
| Romanians | 97.2 /100 | #86 | Exceptional 10.1% |
| Burmese | 97.2 /100 | #87 | Exceptional 10.1% |
| Jordanians | 97.1 /100 | #88 | Exceptional 10.1% |
| Immigrants | Bulgaria | 97.0 /100 | #89 | Exceptional 10.1% |
| Ukrainians | 96.9 /100 | #90 | Exceptional 10.1% |
| Puget Sound Salish | 96.9 /100 | #91 | Exceptional 10.1% |
Demographics Similar to Bangladeshis by Seniors Poverty Over the Age of 65
In terms of seniors poverty over the age of 65, the demographic groups most similar to Bangladeshis are Albanian (11.2%, a difference of 0.090%), Immigrants from Vietnam (11.2%, a difference of 0.16%), Chilean (11.2%, a difference of 0.30%), Taiwanese (11.2%, a difference of 0.45%), and Immigrants from Burma/Myanmar (11.3%, a difference of 0.47%).
| Demographics | Rating | Rank | Seniors Poverty Over the Age of 65 |
| Immigrants | Laos | 35.7 /100 | #189 | Fair 11.1% |
| Indians (Asian) | 34.2 /100 | #190 | Fair 11.1% |
| Immigrants | Uganda | 32.2 /100 | #191 | Fair 11.1% |
| Immigrants | Southern Europe | 30.1 /100 | #192 | Fair 11.1% |
| Taiwanese | 29.2 /100 | #193 | Fair 11.2% |
| Chileans | 27.8 /100 | #194 | Fair 11.2% |
| Immigrants | Vietnam | 26.6 /100 | #195 | Fair 11.2% |
| Bangladeshis | 25.2 /100 | #196 | Fair 11.2% |
| Albanians | 24.4 /100 | #197 | Fair 11.2% |
| Immigrants | Burma/Myanmar | 21.3 /100 | #198 | Fair 11.3% |
| Immigrants | Israel | 20.3 /100 | #199 | Fair 11.3% |
| Alsatians | 20.1 /100 | #200 | Fair 11.3% |
| Immigrants | Brazil | 17.8 /100 | #201 | Poor 11.3% |
| Costa Ricans | 17.0 /100 | #202 | Poor 11.3% |
| Immigrants | Zaire | 16.9 /100 | #203 | Poor 11.3% |