Immigrants from Afghanistan vs Immigrants from Saudi Arabia Seniors Poverty Over the Age of 65
COMPARE
Immigrants from Afghanistan
Immigrants from Saudi Arabia
Seniors Poverty Over the Age of 65
Seniors Poverty Over the Age of 65 Comparison
Immigrants from Afghanistan
Immigrants from Saudi Arabia
10.1%
SENIORS POVERTY OVER THE AGE OF 65
97.2/ 100
METRIC RATING
84th/ 347
METRIC RANK
10.7%
SENIORS POVERTY OVER THE AGE OF 65
74.9/ 100
METRIC RATING
154th/ 347
METRIC RANK
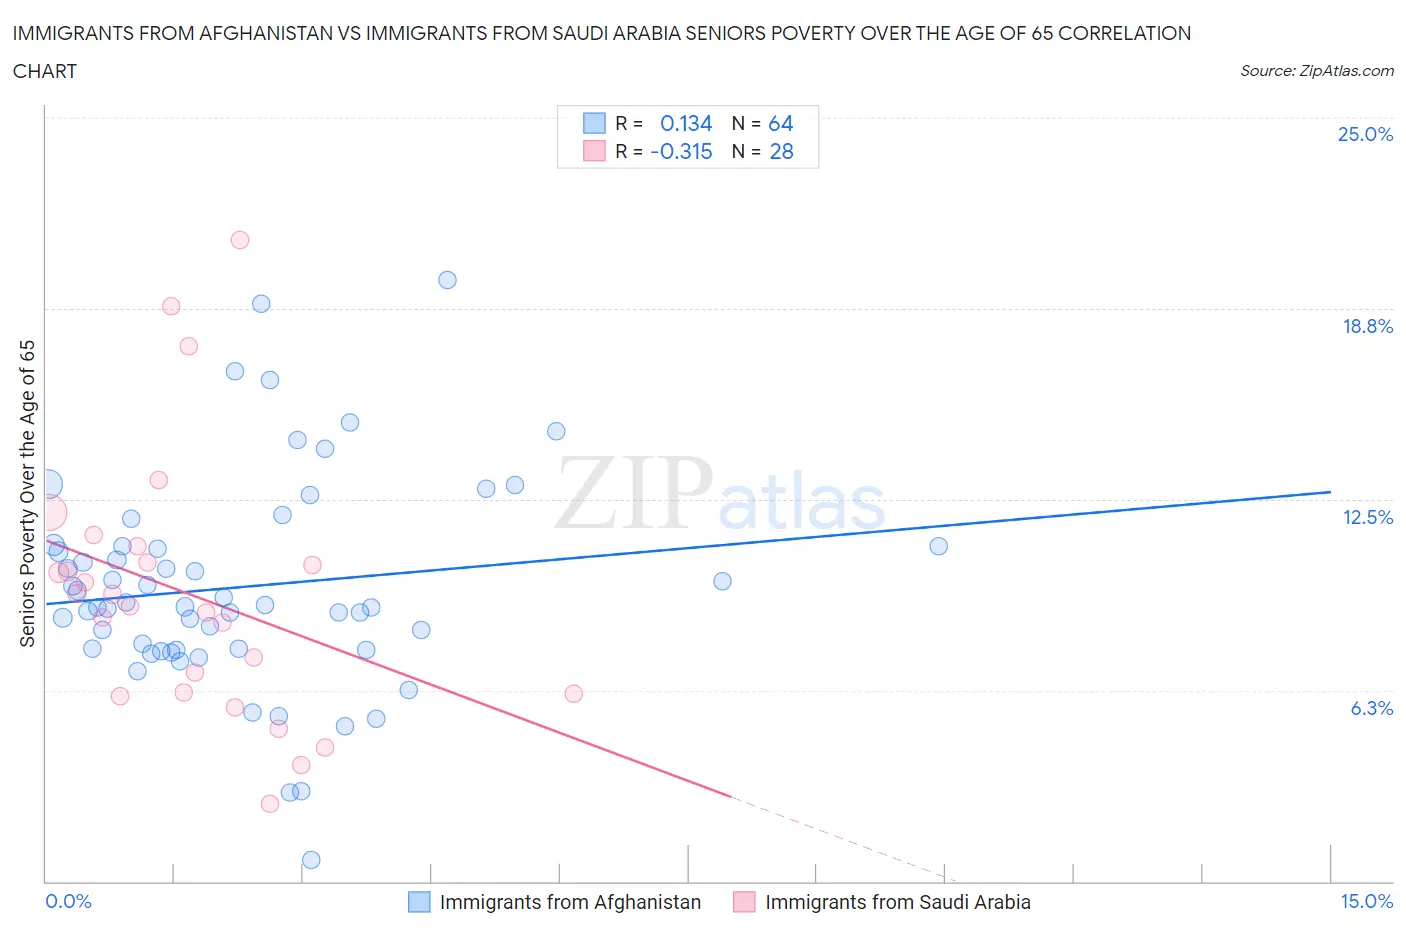
Immigrants from Afghanistan vs Immigrants from Saudi Arabia Seniors Poverty Over the Age of 65 Correlation Chart
The statistical analysis conducted on geographies consisting of 147,505,027 people shows a poor positive correlation between the proportion of Immigrants from Afghanistan and poverty level among seniors over the age of 65 in the United States with a correlation coefficient (R) of 0.134 and weighted average of 10.1%. Similarly, the statistical analysis conducted on geographies consisting of 164,031,623 people shows a mild negative correlation between the proportion of Immigrants from Saudi Arabia and poverty level among seniors over the age of 65 in the United States with a correlation coefficient (R) of -0.315 and weighted average of 10.7%, a difference of 5.9%.
Seniors Poverty Over the Age of 65 Correlation Summary
| Measurement | Immigrants from Afghanistan | Immigrants from Saudi Arabia |
| Minimum | 0.71% | 2.5% |
| Maximum | 19.7% | 21.0% |
| Range | 19.0% | 18.5% |
| Mean | 9.6% | 9.4% |
| Median | 9.0% | 9.2% |
| Interquartile 25% (IQ1) | 7.6% | 6.2% |
| Interquartile 75% (IQ3) | 11.0% | 10.7% |
| Interquartile Range (IQR) | 3.4% | 4.6% |
| Standard Deviation (Sample) | 3.5% | 4.3% |
| Standard Deviation (Population) | 3.5% | 4.2% |
Similar Demographics by Seniors Poverty Over the Age of 65
Demographics Similar to Immigrants from Afghanistan by Seniors Poverty Over the Age of 65
In terms of seniors poverty over the age of 65, the demographic groups most similar to Immigrants from Afghanistan are Immigrants from Nepal (10.1%, a difference of 0.0%), Romanian (10.1%, a difference of 0.020%), Immigrants from Poland (10.1%, a difference of 0.030%), Burmese (10.1%, a difference of 0.040%), and Immigrants from Bolivia (10.1%, a difference of 0.050%).
| Demographics | Rating | Rank | Seniors Poverty Over the Age of 65 |
| Immigrants | South Africa | 97.7 /100 | #77 | Exceptional 10.0% |
| Whites/Caucasians | 97.5 /100 | #78 | Exceptional 10.0% |
| Immigrants | Ireland | 97.5 /100 | #79 | Exceptional 10.0% |
| Koreans | 97.4 /100 | #80 | Exceptional 10.1% |
| Immigrants | Sri Lanka | 97.3 /100 | #81 | Exceptional 10.1% |
| Immigrants | Bolivia | 97.3 /100 | #82 | Exceptional 10.1% |
| Immigrants | Poland | 97.2 /100 | #83 | Exceptional 10.1% |
| Immigrants | Afghanistan | 97.2 /100 | #84 | Exceptional 10.1% |
| Immigrants | Nepal | 97.2 /100 | #85 | Exceptional 10.1% |
| Romanians | 97.2 /100 | #86 | Exceptional 10.1% |
| Burmese | 97.2 /100 | #87 | Exceptional 10.1% |
| Jordanians | 97.1 /100 | #88 | Exceptional 10.1% |
| Immigrants | Bulgaria | 97.0 /100 | #89 | Exceptional 10.1% |
| Ukrainians | 96.9 /100 | #90 | Exceptional 10.1% |
| Puget Sound Salish | 96.9 /100 | #91 | Exceptional 10.1% |
Demographics Similar to Immigrants from Saudi Arabia by Seniors Poverty Over the Age of 65
In terms of seniors poverty over the age of 65, the demographic groups most similar to Immigrants from Saudi Arabia are Fijian (10.7%, a difference of 0.080%), Chickasaw (10.7%, a difference of 0.16%), Immigrants from Egypt (10.6%, a difference of 0.19%), Spanish (10.6%, a difference of 0.23%), and Ethiopian (10.7%, a difference of 0.23%).
| Demographics | Rating | Rank | Seniors Poverty Over the Age of 65 |
| Immigrants | Greece | 79.0 /100 | #147 | Good 10.6% |
| Americans | 78.1 /100 | #148 | Good 10.6% |
| Immigrants | Cameroon | 78.1 /100 | #149 | Good 10.6% |
| Immigrants | Switzerland | 77.3 /100 | #150 | Good 10.6% |
| Spanish | 76.8 /100 | #151 | Good 10.6% |
| Immigrants | Egypt | 76.5 /100 | #152 | Good 10.6% |
| Fijians | 75.6 /100 | #153 | Good 10.7% |
| Immigrants | Saudi Arabia | 74.9 /100 | #154 | Good 10.7% |
| Chickasaw | 73.6 /100 | #155 | Good 10.7% |
| Ethiopians | 72.9 /100 | #156 | Good 10.7% |
| Immigrants | Ethiopia | 72.9 /100 | #157 | Good 10.7% |
| Immigrants | Sierra Leone | 71.7 /100 | #158 | Good 10.7% |
| Immigrants | Micronesia | 70.8 /100 | #159 | Good 10.7% |
| Sudanese | 68.2 /100 | #160 | Good 10.7% |
| Arabs | 65.2 /100 | #161 | Good 10.8% |