Immigrants from Afghanistan vs Immigrants from Haiti Seniors Poverty Over the Age of 65
COMPARE
Immigrants from Afghanistan
Immigrants from Haiti
Seniors Poverty Over the Age of 65
Seniors Poverty Over the Age of 65 Comparison
Immigrants from Afghanistan
Immigrants from Haiti
10.1%
SENIORS POVERTY OVER THE AGE OF 65
97.2/ 100
METRIC RATING
84th/ 347
METRIC RANK
14.7%
SENIORS POVERTY OVER THE AGE OF 65
0.0/ 100
METRIC RATING
320th/ 347
METRIC RANK
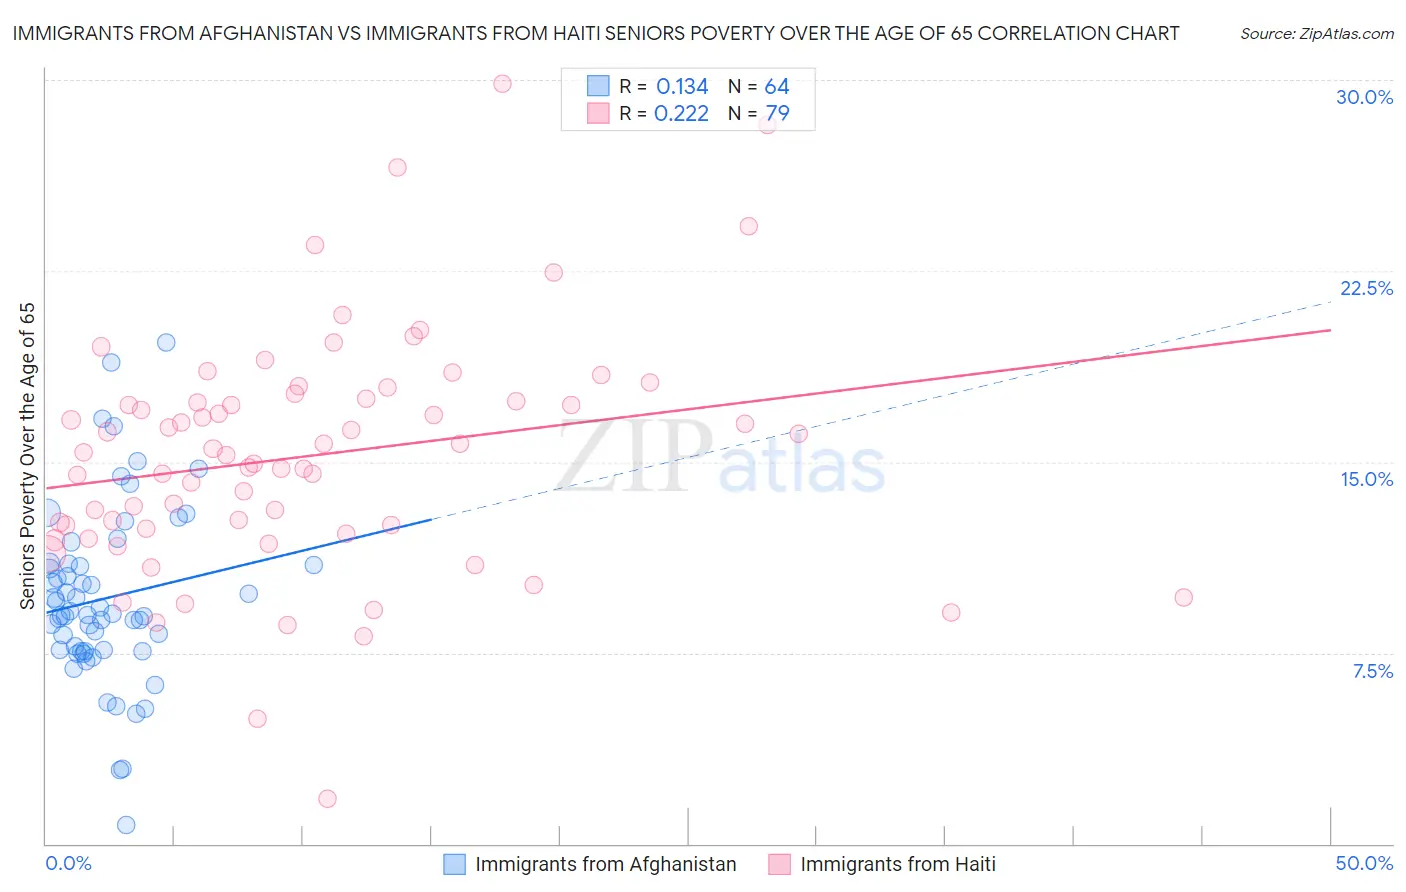
Immigrants from Afghanistan vs Immigrants from Haiti Seniors Poverty Over the Age of 65 Correlation Chart
The statistical analysis conducted on geographies consisting of 147,505,027 people shows a poor positive correlation between the proportion of Immigrants from Afghanistan and poverty level among seniors over the age of 65 in the United States with a correlation coefficient (R) of 0.134 and weighted average of 10.1%. Similarly, the statistical analysis conducted on geographies consisting of 224,688,220 people shows a weak positive correlation between the proportion of Immigrants from Haiti and poverty level among seniors over the age of 65 in the United States with a correlation coefficient (R) of 0.222 and weighted average of 14.7%, a difference of 45.8%.
Seniors Poverty Over the Age of 65 Correlation Summary
| Measurement | Immigrants from Afghanistan | Immigrants from Haiti |
| Minimum | 0.71% | 1.8% |
| Maximum | 19.7% | 29.8% |
| Range | 19.0% | 28.1% |
| Mean | 9.6% | 15.3% |
| Median | 9.0% | 15.4% |
| Interquartile 25% (IQ1) | 7.6% | 12.4% |
| Interquartile 75% (IQ3) | 11.0% | 17.5% |
| Interquartile Range (IQR) | 3.4% | 5.1% |
| Standard Deviation (Sample) | 3.5% | 4.7% |
| Standard Deviation (Population) | 3.5% | 4.7% |
Similar Demographics by Seniors Poverty Over the Age of 65
Demographics Similar to Immigrants from Afghanistan by Seniors Poverty Over the Age of 65
In terms of seniors poverty over the age of 65, the demographic groups most similar to Immigrants from Afghanistan are Immigrants from Nepal (10.1%, a difference of 0.0%), Romanian (10.1%, a difference of 0.020%), Immigrants from Poland (10.1%, a difference of 0.030%), Burmese (10.1%, a difference of 0.040%), and Immigrants from Bolivia (10.1%, a difference of 0.050%).
| Demographics | Rating | Rank | Seniors Poverty Over the Age of 65 |
| Immigrants | South Africa | 97.7 /100 | #77 | Exceptional 10.0% |
| Whites/Caucasians | 97.5 /100 | #78 | Exceptional 10.0% |
| Immigrants | Ireland | 97.5 /100 | #79 | Exceptional 10.0% |
| Koreans | 97.4 /100 | #80 | Exceptional 10.1% |
| Immigrants | Sri Lanka | 97.3 /100 | #81 | Exceptional 10.1% |
| Immigrants | Bolivia | 97.3 /100 | #82 | Exceptional 10.1% |
| Immigrants | Poland | 97.2 /100 | #83 | Exceptional 10.1% |
| Immigrants | Afghanistan | 97.2 /100 | #84 | Exceptional 10.1% |
| Immigrants | Nepal | 97.2 /100 | #85 | Exceptional 10.1% |
| Romanians | 97.2 /100 | #86 | Exceptional 10.1% |
| Burmese | 97.2 /100 | #87 | Exceptional 10.1% |
| Jordanians | 97.1 /100 | #88 | Exceptional 10.1% |
| Immigrants | Bulgaria | 97.0 /100 | #89 | Exceptional 10.1% |
| Ukrainians | 96.9 /100 | #90 | Exceptional 10.1% |
| Puget Sound Salish | 96.9 /100 | #91 | Exceptional 10.1% |
Demographics Similar to Immigrants from Haiti by Seniors Poverty Over the Age of 65
In terms of seniors poverty over the age of 65, the demographic groups most similar to Immigrants from Haiti are Cape Verdean (14.7%, a difference of 0.18%), Houma (14.7%, a difference of 0.21%), Immigrants from Barbados (14.8%, a difference of 0.59%), Yakama (14.8%, a difference of 0.75%), and Immigrants from Honduras (14.5%, a difference of 1.3%).
| Demographics | Rating | Rank | Seniors Poverty Over the Age of 65 |
| Barbadians | 0.0 /100 | #313 | Tragic 14.4% |
| Guyanese | 0.0 /100 | #314 | Tragic 14.4% |
| Immigrants | Ecuador | 0.0 /100 | #315 | Tragic 14.4% |
| Immigrants | Guyana | 0.0 /100 | #316 | Tragic 14.5% |
| Haitians | 0.0 /100 | #317 | Tragic 14.5% |
| Immigrants | Honduras | 0.0 /100 | #318 | Tragic 14.5% |
| Cape Verdeans | 0.0 /100 | #319 | Tragic 14.7% |
| Immigrants | Haiti | 0.0 /100 | #320 | Tragic 14.7% |
| Houma | 0.0 /100 | #321 | Tragic 14.7% |
| Immigrants | Barbados | 0.0 /100 | #322 | Tragic 14.8% |
| Yakama | 0.0 /100 | #323 | Tragic 14.8% |
| Nicaraguans | 0.0 /100 | #324 | Tragic 15.0% |
| Central American Indians | 0.0 /100 | #325 | Tragic 15.1% |
| Immigrants | Armenia | 0.0 /100 | #326 | Tragic 15.2% |
| Crow | 0.0 /100 | #327 | Tragic 15.2% |