Immigrants from Saudi Arabia vs Bangladeshi Seniors Poverty Over the Age of 65

COMPARE

Immigrants from Saudi Arabia
Race
Ancestry
AfghanAfricanAlaska NativeAlaskan AthabascanAlbanianAleutAlsatianAmericanApacheArabArapahoArgentineanArmenianAssyrian/Chaldean/SyriacAustralianAustrianBahamianBarbadianBasqueBelgianBelizeanBermudanBhutaneseBlackfeetBolivianBrazilianBritishBritish West IndianBulgarianBurmeseCajunCambodianCanadianCape VerdeanCarpatho RusynCelticCentral AmericanCentral American IndianCherokeeCheyenneChickasawChileanChineseChippewaChoctawColombianColvilleComancheCosta RicanCreeCreekCroatianCrowCubanCypriotCzechCzechoslovakianDanishDelawareDominicanDutchDutch West IndianEastern EuropeanEcuadorianEgyptianEnglishEstonianEthiopianEuropeanFijianFilipinoFinnishFrenchFrench American IndianFrench CanadianGermanGerman RussianGhanaianGreekGuamanian/ChamorroGuatemalanGuyaneseHaitianHmongHonduranHopiHoumaHungarianIcelanderIndian (Asian)IndonesianInupiatIranianIraqiIrishIroquoisIsraeliItalianJamaicanJapaneseJordanianKenyanKiowaKoreanLaotianLatvianLebaneseLiberianLithuanianLumbeeLuxembourgerMacedonianMalaysianMalteseMarshalleseMenomineeMexicanMexican American IndianMongolianMoroccanNative HawaiianNavajoNepaleseNew ZealanderNicaraguanNigerianNorthern EuropeanNorwegianOkinawanOsageOttawaPaiutePakistaniPalestinianPanamanianParaguayanPennsylvania GermanPeruvianPimaPolishPortuguesePotawatomiPuebloPuerto RicanPuget Sound SalishRomanianRussianSalvadoranSamoanScandinavianScotch-IrishScottishSeminoleSenegaleseSerbianShoshoneSierra LeoneanSiouxSlavicSlovakSloveneSomaliSouth AfricanSouth AmericanSouth American IndianSoviet UnionSpaniardSpanishSpanish AmericanSpanish American IndianSri LankanSubsaharan AfricanSudaneseSwedishSwissSyrianTaiwaneseThaiTlingit-HaidaTohono O'OdhamTonganTrinidadian and TobagonianTsimshianTurkishU.S. Virgin IslanderUgandanUkrainianUruguayanUteVenezuelanVietnameseWelshWest IndianYakamaYaquiYugoslavianYumanYup'ikZimbabwean
Immigration
NonimmigrantsImmigrantsAfghanistanAfricaAlbaniaArgentinaArmeniaAsiaAustraliaAustriaBahamasBangladeshBarbadosBelarusBelgiumBelizeBoliviaBosnia and HerzegovinaBrazilBulgariaBurma/MyanmarCabo VerdeCambodiaCameroonCanadaCaribbeanCentral AmericaChileChinaColombiaCongoCosta RicaCroatiaCubaCzechoslovakiaDenmarkDominicaDominican RepublicEastern AfricaEastern AsiaEastern EuropeEcuadorEgyptEl SalvadorEnglandEritreaEthiopiaEuropeFijiFranceGermanyGhanaGreeceGrenadaGuatemalaGuyanaHaitiHondurasHong KongHungaryIndiaIndonesiaIranIraqIrelandIsraelItalyJamaicaJapanJordanKazakhstanKenyaKoreaKuwaitLaosLatin AmericaLatviaLebanonLiberiaLithuaniaMalaysiaMexicoMicronesiaMiddle AfricaMoldovaMoroccoNepalNetherlandsNicaraguaNigeriaNorth AmericaNorth MacedoniaNorthern AfricaNorthern EuropeNorwayOceaniaPakistanPanamaPeruPhilippinesPolandPortugalRomaniaRussiaSaudi ArabiaScotlandSenegalSerbiaSierra LeoneSingaporeSomaliaSouth AfricaSouth AmericaSouth Central AsiaSouth Eastern AsiaSouthern EuropeSpainSri LankaSt. Vincent and the GrenadinesSudanSwedenSwitzerlandSyriaTaiwanThailandTrinidad and TobagoTurkeyUgandaUkraineUruguayUzbekistanVenezuelaVietnamWest IndiesWestern AfricaWestern AsiaWestern EuropeYemenZaireZimbabweAzores
Bangladeshi
Race
Ancestry
AfghanAfricanAlaska NativeAlaskan AthabascanAlbanianAleutAlsatianAmericanApacheArabArapahoArgentineanArmenianAssyrian/Chaldean/SyriacAustralianAustrianBahamianBangladeshiBarbadianBasqueBelgianBelizeanBermudanBhutaneseBlackfeetBolivianBrazilianBritishBritish West IndianBulgarianBurmeseCajunCambodianCanadianCape VerdeanCarpatho RusynCelticCentral AmericanCentral American IndianCherokeeCheyenneChickasawChileanChineseChippewaChoctawColombianColvilleComancheCosta RicanCreeCreekCroatianCrowCubanCypriotCzechCzechoslovakianDanishDelawareDominicanDutchDutch West IndianEastern EuropeanEcuadorianEgyptianEnglishEstonianEthiopianEuropeanFijianFilipinoFinnishFrenchFrench American IndianFrench CanadianGermanGerman RussianGhanaianGreekGuamanian/ChamorroGuatemalanGuyaneseHaitianHmongHonduranHopiHoumaHungarianIcelanderIndian (Asian)IndonesianInupiatIranianIraqiIrishIroquoisIsraeliItalianJamaicanJapaneseJordanianKenyanKiowaKoreanLaotianLatvianLebaneseLiberianLithuanianLumbeeLuxembourgerMacedonianMalaysianMalteseMarshalleseMenomineeMexicanMexican American IndianMongolianMoroccanNative HawaiianNavajoNepaleseNew ZealanderNicaraguanNigerianNorthern EuropeanNorwegianOkinawanOsageOttawaPaiutePakistaniPalestinianPanamanianParaguayanPennsylvania GermanPeruvianPimaPolishPortuguesePotawatomiPuebloPuerto RicanPuget Sound SalishRomanianRussianSalvadoranSamoanScandinavianScotch-IrishScottishSeminoleSenegaleseSerbianShoshoneSierra LeoneanSiouxSlavicSlovakSloveneSomaliSouth AfricanSouth AmericanSouth American IndianSoviet UnionSpaniardSpanishSpanish AmericanSpanish American IndianSri LankanSubsaharan AfricanSudaneseSwedishSwissSyrianTaiwaneseThaiTlingit-HaidaTohono O'OdhamTonganTrinidadian and TobagonianTsimshianTurkishU.S. Virgin IslanderUgandanUkrainianUruguayanUteVenezuelanVietnameseWelshWest IndianYakamaYaquiYugoslavianYumanYup'ikZimbabwean
Immigration
NonimmigrantsImmigrantsAfghanistanAfricaAlbaniaArgentinaArmeniaAsiaAustraliaAustriaBahamasBangladeshBarbadosBelarusBelgiumBelizeBoliviaBosnia and HerzegovinaBrazilBulgariaBurma/MyanmarCabo VerdeCambodiaCameroonCanadaCaribbeanCentral AmericaChileChinaColombiaCongoCosta RicaCroatiaCubaCzechoslovakiaDenmarkDominicaDominican RepublicEastern AfricaEastern AsiaEastern EuropeEcuadorEgyptEl SalvadorEnglandEritreaEthiopiaEuropeFijiFranceGermanyGhanaGreeceGrenadaGuatemalaGuyanaHaitiHondurasHong KongHungaryIndiaIndonesiaIranIraqIrelandIsraelItalyJamaicaJapanJordanKazakhstanKenyaKoreaKuwaitLaosLatin AmericaLatviaLebanonLiberiaLithuaniaMalaysiaMexicoMicronesiaMiddle AfricaMoldovaMoroccoNepalNetherlandsNicaraguaNigeriaNorth AmericaNorth MacedoniaNorthern AfricaNorthern EuropeNorwayOceaniaPakistanPanamaPeruPhilippinesPolandPortugalRomaniaRussiaScotlandSenegalSerbiaSierra LeoneSingaporeSomaliaSouth AfricaSouth AmericaSouth Central AsiaSouth Eastern AsiaSouthern EuropeSpainSri LankaSt. Vincent and the GrenadinesSudanSwedenSwitzerlandSyriaTaiwanThailandTrinidad and TobagoTurkeyUgandaUkraineUruguayUzbekistanVenezuelaVietnamWest IndiesWestern AfricaWestern AsiaWestern EuropeYemenZaireZimbabweAzores
Seniors Poverty Over the Age of 65
Income
Poverty
Unemployment
Labor Participation
Family Structure
Vehicle Availability
Education Level
Disability

Seniors Poverty Over the Age of 65 Comparison

Immigrants from Saudi Arabia

Bangladeshis

Good
Fair
10.7%
SENIORS POVERTY OVER THE AGE OF 65
74.9/ 100
METRIC RATING
154th/ 347
METRIC RANK
11.2%
SENIORS POVERTY OVER THE AGE OF 65
25.2/ 100
METRIC RATING
196th/ 347
METRIC RANK

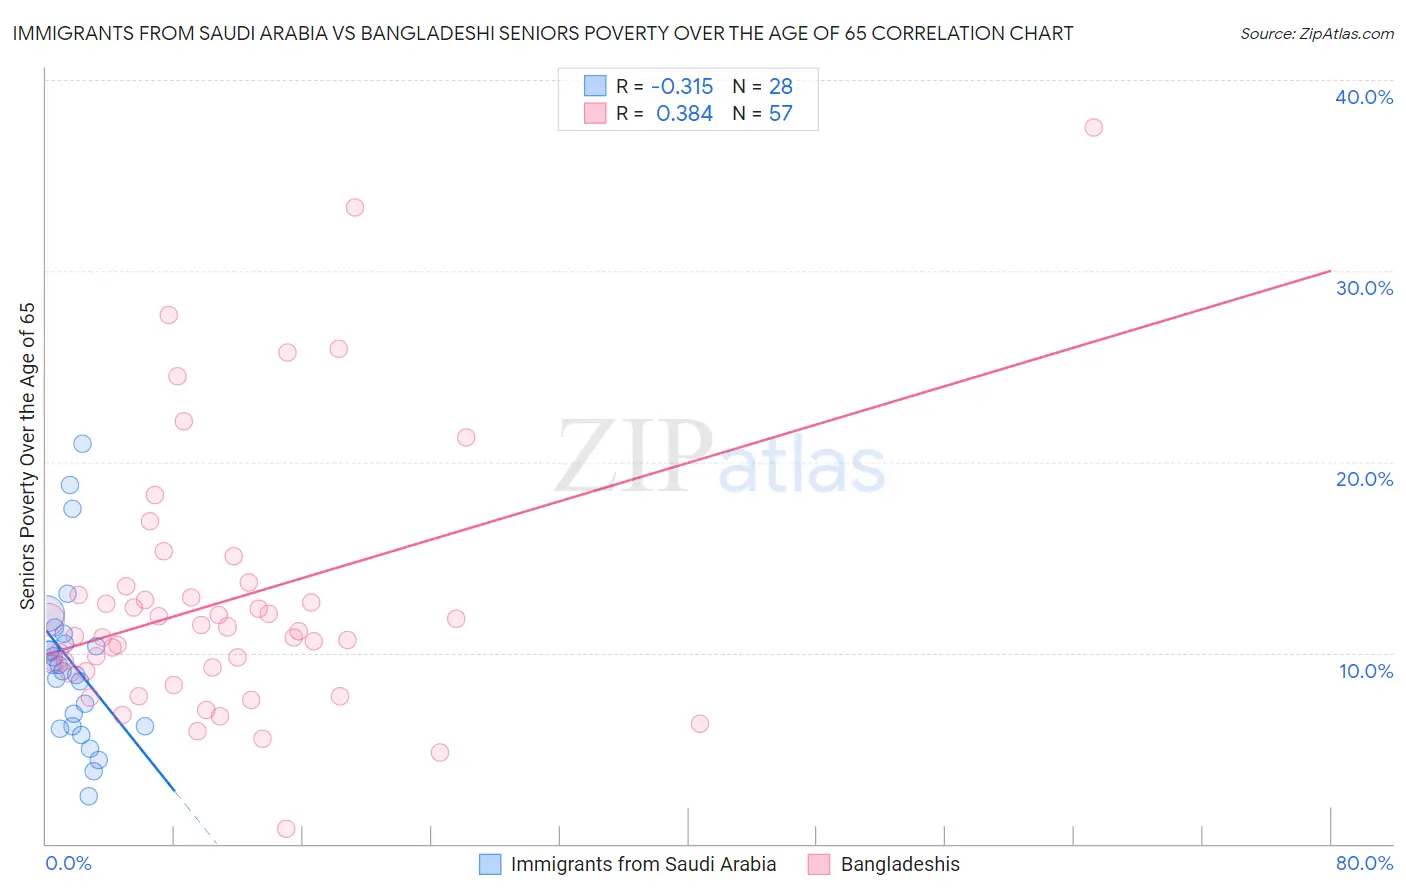
Immigrants from Saudi Arabia vs Bangladeshi Seniors Poverty Over the Age of 65 Correlation Chart

The statistical analysis conducted on geographies consisting of 164,031,623 people shows a mild negative correlation between the proportion of Immigrants from Saudi Arabia and poverty level among seniors over the age of 65 in the United States with a correlation coefficient (R) of -0.315 and weighted average of 10.7%. Similarly, the statistical analysis conducted on geographies consisting of 140,940,566 people shows a mild positive correlation between the proportion of Bangladeshis and poverty level among seniors over the age of 65 in the United States with a correlation coefficient (R) of 0.384 and weighted average of 11.2%, a difference of 5.0%.
Immigrants from Saudi Arabia vs Bangladeshi Seniors Poverty Over the Age of 65

Seniors Poverty Over the Age of 65 Correlation Summary

MeasurementImmigrants from Saudi ArabiaBangladeshi
Minimum2.5%0.78%
Maximum21.0%37.5%
Range18.5%36.7%
Mean9.4%12.7%
Median9.2%11.1%
Interquartile 25% (IQ1)6.2%9.0%
Interquartile 75% (IQ3)10.7%13.3%
Interquartile Range (IQR)4.6%4.3%
Standard Deviation (Sample)4.3%6.9%
Standard Deviation (Population)4.2%6.8%

Similar Demographics by Seniors Poverty Over the Age of 65

Demographics Similar to Immigrants from Saudi Arabia by Seniors Poverty Over the Age of 65

In terms of seniors poverty over the age of 65, the demographic groups most similar to Immigrants from Saudi Arabia are Fijian (10.7%, a difference of 0.080%), Chickasaw (10.7%, a difference of 0.16%), Immigrants from Egypt (10.6%, a difference of 0.19%), Spanish (10.6%, a difference of 0.23%), and Ethiopian (10.7%, a difference of 0.23%).
DemographicsRating | RankSeniors Poverty Over the Age of 65
Immigrants | Greece
79.0
/100
|
#147
Good
10.6%
Americans
78.1
/100
|
#148
Good
10.6%
Immigrants | Cameroon
78.1
/100
|
#149
Good
10.6%
Immigrants | Switzerland
77.3
/100
|
#150
Good
10.6%
Spanish
76.8
/100
|
#151
Good
10.6%
Immigrants | Egypt
76.5
/100
|
#152
Good
10.6%
Fijians
75.6
/100
|
#153
Good
10.7%
Immigrants | Saudi Arabia
74.9
/100
|
#154
Good
10.7%
Chickasaw
73.6
/100
|
#155
Good
10.7%
Ethiopians
72.9
/100
|
#156
Good
10.7%
Immigrants | Ethiopia
72.9
/100
|
#157
Good
10.7%
Immigrants | Sierra Leone
71.7
/100
|
#158
Good
10.7%
Immigrants | Micronesia
70.8
/100
|
#159
Good
10.7%
Sudanese
68.2
/100
|
#160
Good
10.7%
Arabs
65.2
/100
|
#161
Good
10.8%

Demographics Similar to Bangladeshis by Seniors Poverty Over the Age of 65

In terms of seniors poverty over the age of 65, the demographic groups most similar to Bangladeshis are Albanian (11.2%, a difference of 0.090%), Immigrants from Vietnam (11.2%, a difference of 0.16%), Chilean (11.2%, a difference of 0.30%), Taiwanese (11.2%, a difference of 0.45%), and Immigrants from Burma/Myanmar (11.3%, a difference of 0.47%).
DemographicsRating | RankSeniors Poverty Over the Age of 65
Immigrants | Laos
35.7
/100
|
#189
Fair
11.1%
Indians (Asian)
34.2
/100
|
#190
Fair
11.1%
Immigrants | Uganda
32.2
/100
|
#191
Fair
11.1%
Immigrants | Southern Europe
30.1
/100
|
#192
Fair
11.1%
Taiwanese
29.2
/100
|
#193
Fair
11.2%
Chileans
27.8
/100
|
#194
Fair
11.2%
Immigrants | Vietnam
26.6
/100
|
#195
Fair
11.2%
Bangladeshis
25.2
/100
|
#196
Fair
11.2%
Albanians
24.4
/100
|
#197
Fair
11.2%
Immigrants | Burma/Myanmar
21.3
/100
|
#198
Fair
11.3%
Immigrants | Israel
20.3
/100
|
#199
Fair
11.3%
Alsatians
20.1
/100
|
#200
Fair
11.3%
Immigrants | Brazil
17.8
/100
|
#201
Poor
11.3%
Costa Ricans
17.0
/100
|
#202
Poor
11.3%
Immigrants | Zaire
16.9
/100
|
#203
Poor
11.3%