Immigrants from St. Vincent and the Grenadines vs Immigrants from Japan Seniors Poverty Over the Age of 75
COMPARE
Immigrants from St. Vincent and the Grenadines
Immigrants from Japan
Seniors Poverty Over the Age of 75
Seniors Poverty Over the Age of 75 Comparison
Immigrants from St. Vincent and the Grenadines
Immigrants from Japan
17.5%
SENIORS POVERTY OVER THE AGE OF 75
0.0/ 100
METRIC RATING
332nd/ 347
METRIC RANK
11.6%
SENIORS POVERTY OVER THE AGE OF 75
91.9/ 100
METRIC RATING
98th/ 347
METRIC RANK
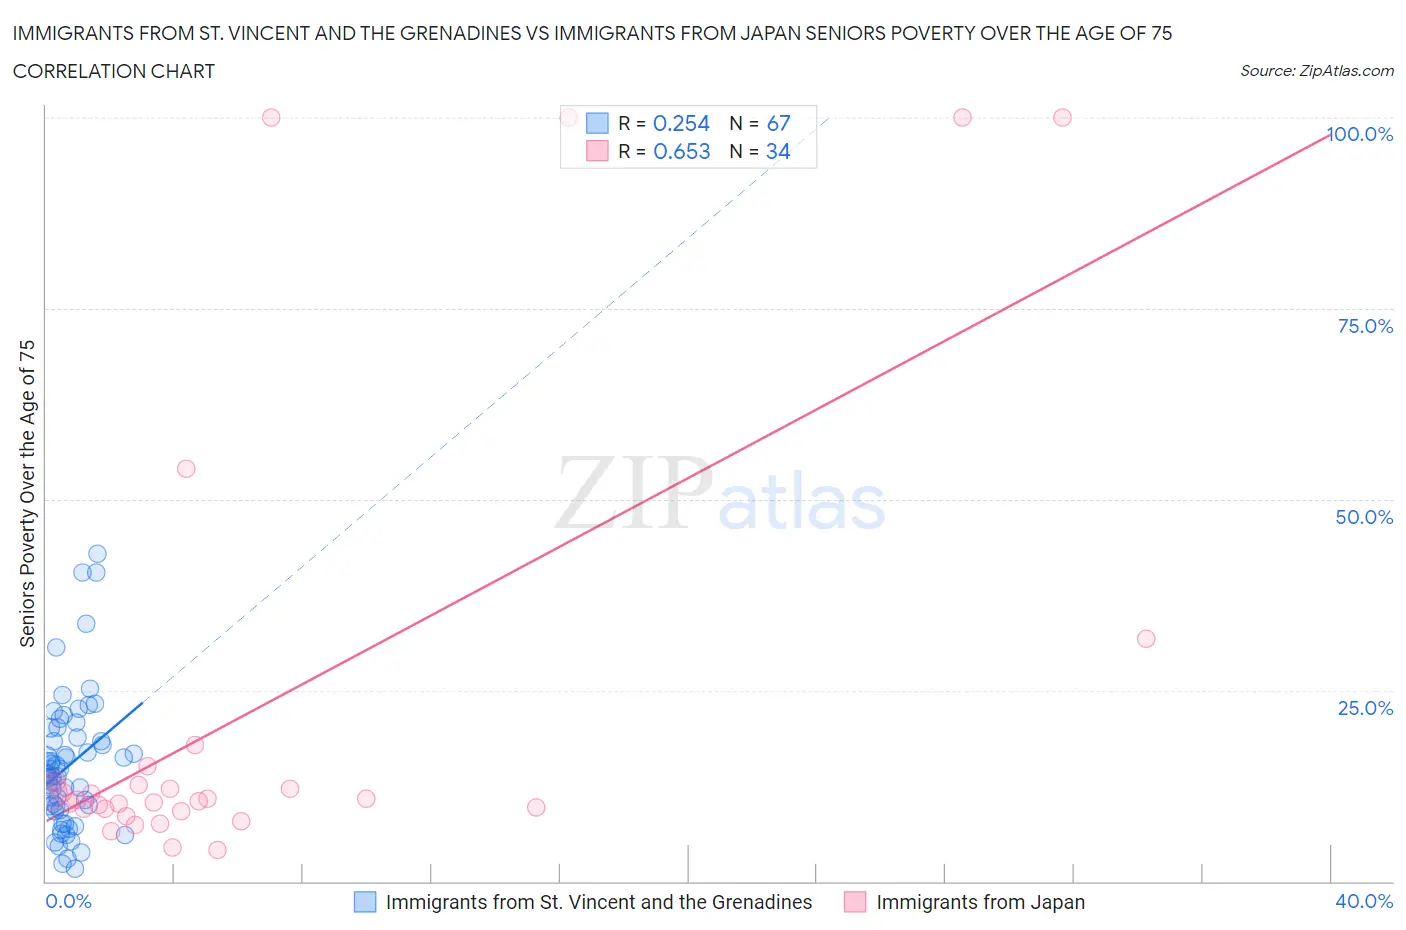
Immigrants from St. Vincent and the Grenadines vs Immigrants from Japan Seniors Poverty Over the Age of 75 Correlation Chart
The statistical analysis conducted on geographies consisting of 56,047,210 people shows a weak positive correlation between the proportion of Immigrants from St. Vincent and the Grenadines and poverty level among seniors over the age of 75 in the United States with a correlation coefficient (R) of 0.254 and weighted average of 17.5%. Similarly, the statistical analysis conducted on geographies consisting of 336,933,586 people shows a significant positive correlation between the proportion of Immigrants from Japan and poverty level among seniors over the age of 75 in the United States with a correlation coefficient (R) of 0.653 and weighted average of 11.6%, a difference of 51.1%.
Seniors Poverty Over the Age of 75 Correlation Summary
| Measurement | Immigrants from St. Vincent and the Grenadines | Immigrants from Japan |
| Minimum | 1.6% | 4.0% |
| Maximum | 42.8% | 100.0% |
| Range | 41.2% | 96.0% |
| Mean | 15.1% | 22.7% |
| Median | 13.9% | 10.7% |
| Interquartile 25% (IQ1) | 9.3% | 9.4% |
| Interquartile 75% (IQ3) | 18.8% | 13.1% |
| Interquartile Range (IQR) | 9.4% | 3.7% |
| Standard Deviation (Sample) | 8.7% | 29.9% |
| Standard Deviation (Population) | 8.7% | 29.5% |
Similar Demographics by Seniors Poverty Over the Age of 75
Demographics Similar to Immigrants from St. Vincent and the Grenadines by Seniors Poverty Over the Age of 75
In terms of seniors poverty over the age of 75, the demographic groups most similar to Immigrants from St. Vincent and the Grenadines are Immigrants from Armenia (17.5%, a difference of 0.26%), Immigrants from Nicaragua (17.6%, a difference of 0.47%), British West Indian (17.4%, a difference of 0.52%), Immigrants from Grenada (17.8%, a difference of 2.0%), and Cuban (18.0%, a difference of 2.6%).
| Demographics | Rating | Rank | Seniors Poverty Over the Age of 75 |
| Nicaraguans | 0.0 /100 | #325 | Tragic 16.6% |
| Pueblo | 0.0 /100 | #326 | Tragic 16.7% |
| Sioux | 0.0 /100 | #327 | Tragic 16.8% |
| Cape Verdeans | 0.0 /100 | #328 | Tragic 16.8% |
| Immigrants | Dominica | 0.0 /100 | #329 | Tragic 17.0% |
| British West Indians | 0.0 /100 | #330 | Tragic 17.4% |
| Immigrants | Armenia | 0.0 /100 | #331 | Tragic 17.5% |
| Immigrants | St. Vincent and the Grenadines | 0.0 /100 | #332 | Tragic 17.5% |
| Immigrants | Nicaragua | 0.0 /100 | #333 | Tragic 17.6% |
| Immigrants | Grenada | 0.0 /100 | #334 | Tragic 17.8% |
| Cubans | 0.0 /100 | #335 | Tragic 18.0% |
| Immigrants | Caribbean | 0.0 /100 | #336 | Tragic 18.2% |
| Yakama | 0.0 /100 | #337 | Tragic 18.3% |
| Immigrants | Cabo Verde | 0.0 /100 | #338 | Tragic 18.5% |
| Hopi | 0.0 /100 | #339 | Tragic 18.9% |
Demographics Similar to Immigrants from Japan by Seniors Poverty Over the Age of 75
In terms of seniors poverty over the age of 75, the demographic groups most similar to Immigrants from Japan are Immigrants from Ethiopia (11.6%, a difference of 0.070%), Romanian (11.6%, a difference of 0.11%), Immigrants from Bosnia and Herzegovina (11.6%, a difference of 0.20%), Immigrants from Sweden (11.6%, a difference of 0.20%), and Syrian (11.6%, a difference of 0.23%).
| Demographics | Rating | Rank | Seniors Poverty Over the Age of 75 |
| Immigrants | Germany | 94.1 /100 | #91 | Exceptional 11.5% |
| Kenyans | 93.9 /100 | #92 | Exceptional 11.5% |
| Immigrants | Poland | 92.9 /100 | #93 | Exceptional 11.6% |
| Creek | 92.7 /100 | #94 | Exceptional 11.6% |
| Immigrants | Bosnia and Herzegovina | 92.6 /100 | #95 | Exceptional 11.6% |
| Immigrants | Sweden | 92.6 /100 | #96 | Exceptional 11.6% |
| Romanians | 92.3 /100 | #97 | Exceptional 11.6% |
| Immigrants | Japan | 91.9 /100 | #98 | Exceptional 11.6% |
| Immigrants | Ethiopia | 91.7 /100 | #99 | Exceptional 11.6% |
| Syrians | 91.1 /100 | #100 | Exceptional 11.6% |
| Jordanians | 90.8 /100 | #101 | Exceptional 11.6% |
| Guamanians/Chamorros | 90.6 /100 | #102 | Exceptional 11.6% |
| Immigrants | Kuwait | 90.5 /100 | #103 | Exceptional 11.6% |
| Immigrants | Singapore | 90.3 /100 | #104 | Exceptional 11.6% |
| Chickasaw | 90.2 /100 | #105 | Exceptional 11.6% |