Immigrants from Sri Lanka vs Immigrants from Colombia Female Poverty Among 18-24 Year Olds
COMPARE
Immigrants from Sri Lanka
Immigrants from Colombia
Female Poverty Among 18-24 Year Olds
Female Poverty Among 18-24 Year Olds Comparison
Immigrants from Sri Lanka
Immigrants from Colombia
19.2%
FEMALE POVERTY AMONG 18-24 YEAR OLDS
97.5/ 100
METRIC RATING
107th/ 347
METRIC RANK
17.3%
FEMALE POVERTY AMONG 18-24 YEAR OLDS
100.0/ 100
METRIC RATING
18th/ 347
METRIC RANK
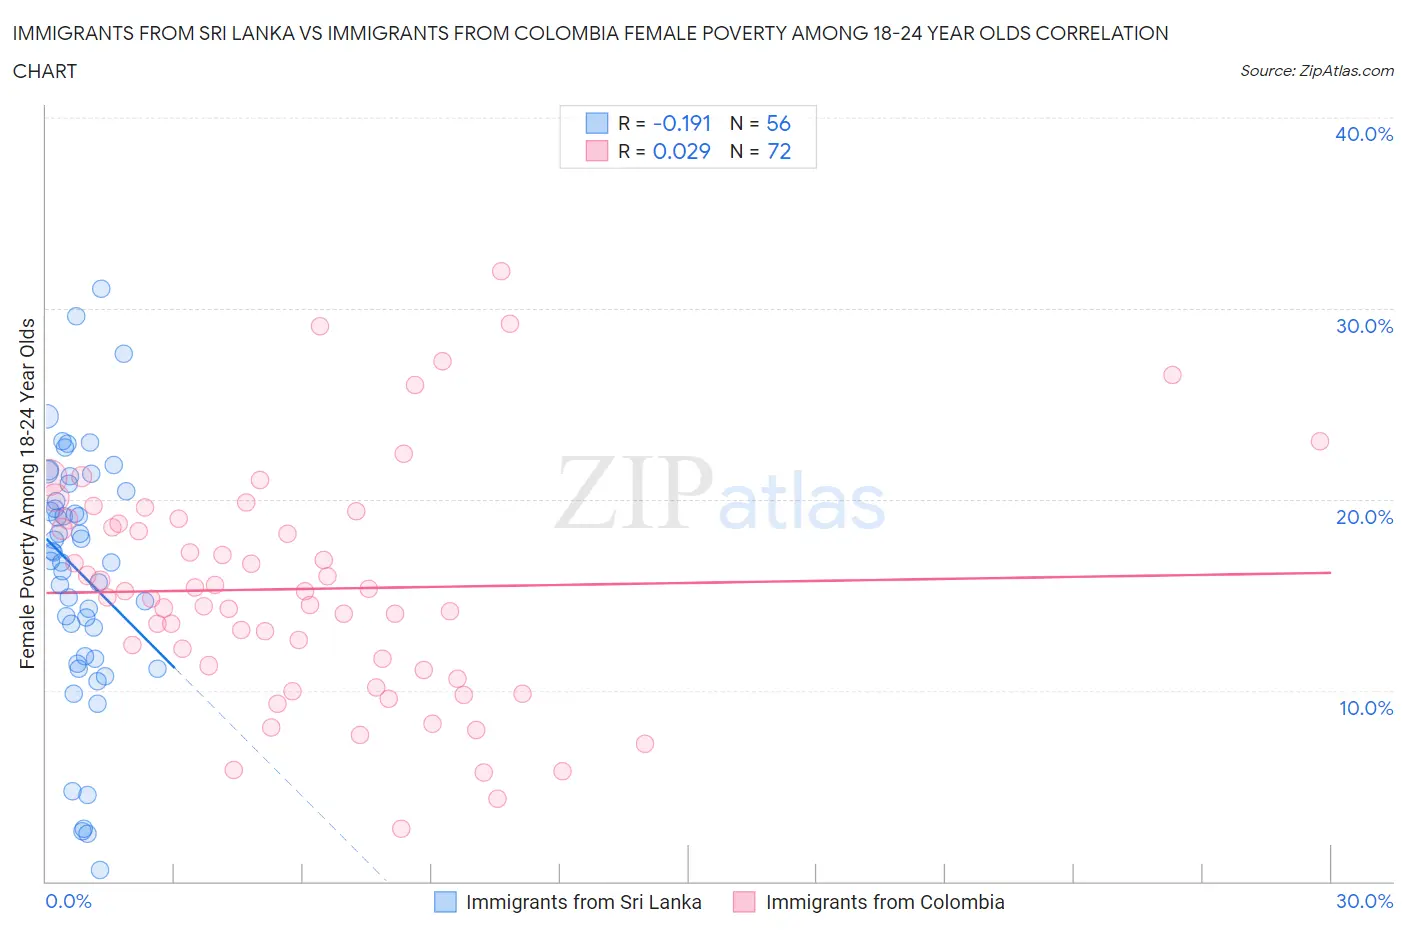
Immigrants from Sri Lanka vs Immigrants from Colombia Female Poverty Among 18-24 Year Olds Correlation Chart
The statistical analysis conducted on geographies consisting of 148,449,032 people shows a poor negative correlation between the proportion of Immigrants from Sri Lanka and poverty level among females between the ages 18 and 24 in the United States with a correlation coefficient (R) of -0.191 and weighted average of 19.2%. Similarly, the statistical analysis conducted on geographies consisting of 369,842,642 people shows no correlation between the proportion of Immigrants from Colombia and poverty level among females between the ages 18 and 24 in the United States with a correlation coefficient (R) of 0.029 and weighted average of 17.3%, a difference of 10.7%.
Female Poverty Among 18-24 Year Olds Correlation Summary
| Measurement | Immigrants from Sri Lanka | Immigrants from Colombia |
| Minimum | 0.58% | 2.8% |
| Maximum | 31.0% | 32.0% |
| Range | 30.5% | 29.2% |
| Mean | 16.2% | 15.3% |
| Median | 17.0% | 15.0% |
| Interquartile 25% (IQ1) | 11.7% | 11.2% |
| Interquartile 75% (IQ3) | 20.6% | 18.9% |
| Interquartile Range (IQR) | 8.9% | 7.7% |
| Standard Deviation (Sample) | 6.6% | 6.0% |
| Standard Deviation (Population) | 6.6% | 6.0% |
Similar Demographics by Female Poverty Among 18-24 Year Olds
Demographics Similar to Immigrants from Sri Lanka by Female Poverty Among 18-24 Year Olds
In terms of female poverty among 18-24 year olds, the demographic groups most similar to Immigrants from Sri Lanka are Immigrants from Uzbekistan (19.2%, a difference of 0.090%), Immigrants from Sierra Leone (19.2%, a difference of 0.15%), Immigrants from Syria (19.2%, a difference of 0.17%), Immigrants from Ecuador (19.2%, a difference of 0.19%), and Laotian (19.2%, a difference of 0.20%).
| Demographics | Rating | Rank | Female Poverty Among 18-24 Year Olds |
| Chileans | 98.3 /100 | #100 | Exceptional 19.1% |
| Ecuadorians | 98.1 /100 | #101 | Exceptional 19.1% |
| Immigrants | Caribbean | 98.1 /100 | #102 | Exceptional 19.1% |
| Serbians | 98.0 /100 | #103 | Exceptional 19.1% |
| Immigrants | Afghanistan | 98.0 /100 | #104 | Exceptional 19.1% |
| Immigrants | Ecuador | 97.8 /100 | #105 | Exceptional 19.2% |
| Immigrants | Sierra Leone | 97.8 /100 | #106 | Exceptional 19.2% |
| Immigrants | Sri Lanka | 97.5 /100 | #107 | Exceptional 19.2% |
| Immigrants | Uzbekistan | 97.3 /100 | #108 | Exceptional 19.2% |
| Immigrants | Syria | 97.2 /100 | #109 | Exceptional 19.2% |
| Laotians | 97.1 /100 | #110 | Exceptional 19.2% |
| Immigrants | Serbia | 97.1 /100 | #111 | Exceptional 19.2% |
| Immigrants | El Salvador | 96.5 /100 | #112 | Exceptional 19.3% |
| Immigrants | Cameroon | 96.3 /100 | #113 | Exceptional 19.3% |
| Slovenes | 96.2 /100 | #114 | Exceptional 19.3% |
Demographics Similar to Immigrants from Colombia by Female Poverty Among 18-24 Year Olds
In terms of female poverty among 18-24 year olds, the demographic groups most similar to Immigrants from Colombia are Immigrants from Lithuania (17.4%, a difference of 0.41%), Immigrants from Taiwan (17.3%, a difference of 0.46%), Immigrants from Venezuela (17.4%, a difference of 0.54%), Bolivian (17.4%, a difference of 0.54%), and Immigrants from Hong Kong (17.5%, a difference of 0.64%).
| Demographics | Rating | Rank | Female Poverty Among 18-24 Year Olds |
| Thais | 100.0 /100 | #11 | Exceptional 17.0% |
| Immigrants | Pakistan | 100.0 /100 | #12 | Exceptional 17.0% |
| Immigrants | Poland | 100.0 /100 | #13 | Exceptional 17.1% |
| Tongans | 100.0 /100 | #14 | Exceptional 17.1% |
| Cubans | 100.0 /100 | #15 | Exceptional 17.2% |
| Peruvians | 100.0 /100 | #16 | Exceptional 17.2% |
| Immigrants | Taiwan | 100.0 /100 | #17 | Exceptional 17.3% |
| Immigrants | Colombia | 100.0 /100 | #18 | Exceptional 17.3% |
| Immigrants | Lithuania | 100.0 /100 | #19 | Exceptional 17.4% |
| Immigrants | Venezuela | 100.0 /100 | #20 | Exceptional 17.4% |
| Bolivians | 100.0 /100 | #21 | Exceptional 17.4% |
| Immigrants | Hong Kong | 100.0 /100 | #22 | Exceptional 17.5% |
| Immigrants | North Macedonia | 100.0 /100 | #23 | Exceptional 17.6% |
| Maltese | 100.0 /100 | #24 | Exceptional 17.6% |
| Immigrants | South Central Asia | 100.0 /100 | #25 | Exceptional 17.6% |