Hungarian vs Armenian Seniors Poverty Over the Age of 65
COMPARE
Hungarian
Armenian
Seniors Poverty Over the Age of 65
Seniors Poverty Over the Age of 65 Comparison
Hungarians
Armenians
9.7%
SENIORS POVERTY OVER THE AGE OF 65
99.4/ 100
METRIC RATING
50th/ 347
METRIC RANK
12.3%
SENIORS POVERTY OVER THE AGE OF 65
0.3/ 100
METRIC RATING
252nd/ 347
METRIC RANK
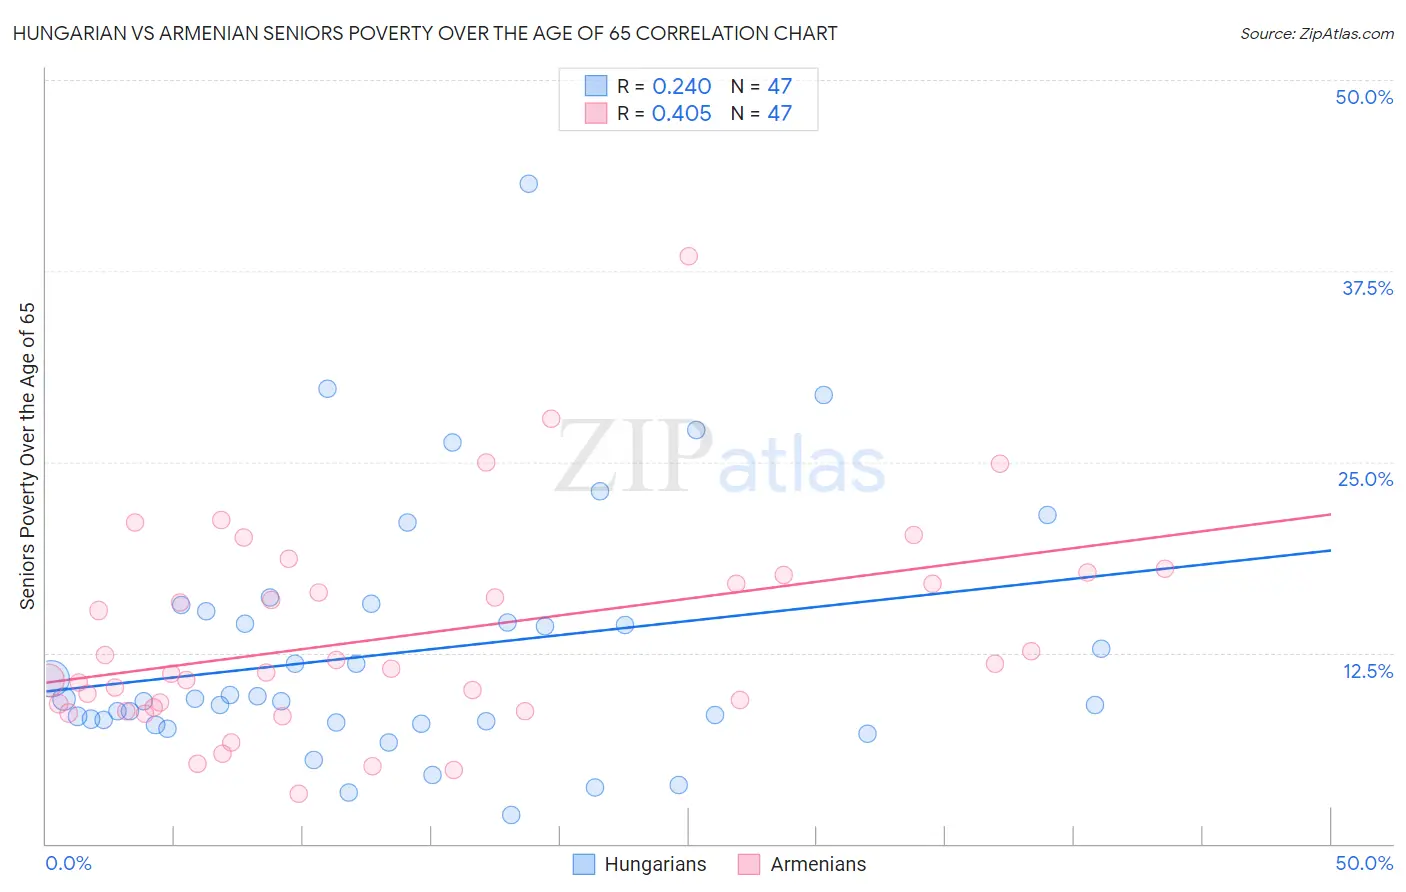
Hungarian vs Armenian Seniors Poverty Over the Age of 65 Correlation Chart
The statistical analysis conducted on geographies consisting of 483,559,616 people shows a weak positive correlation between the proportion of Hungarians and poverty level among seniors over the age of 65 in the United States with a correlation coefficient (R) of 0.240 and weighted average of 9.7%. Similarly, the statistical analysis conducted on geographies consisting of 310,185,969 people shows a moderate positive correlation between the proportion of Armenians and poverty level among seniors over the age of 65 in the United States with a correlation coefficient (R) of 0.405 and weighted average of 12.3%, a difference of 27.1%.
Seniors Poverty Over the Age of 65 Correlation Summary
| Measurement | Hungarian | Armenian |
| Minimum | 1.9% | 3.3% |
| Maximum | 43.2% | 38.5% |
| Range | 41.3% | 35.2% |
| Mean | 12.6% | 13.6% |
| Median | 9.5% | 11.4% |
| Interquartile 25% (IQ1) | 7.9% | 8.9% |
| Interquartile 75% (IQ3) | 15.2% | 17.6% |
| Interquartile Range (IQR) | 7.3% | 8.7% |
| Standard Deviation (Sample) | 8.2% | 6.8% |
| Standard Deviation (Population) | 8.1% | 6.7% |
Similar Demographics by Seniors Poverty Over the Age of 65
Demographics Similar to Hungarians by Seniors Poverty Over the Age of 65
In terms of seniors poverty over the age of 65, the demographic groups most similar to Hungarians are Immigrants from Lithuania (9.7%, a difference of 0.22%), French (9.7%, a difference of 0.28%), Immigrants from South Central Asia (9.7%, a difference of 0.39%), Immigrants from Taiwan (9.7%, a difference of 0.40%), and Carpatho Rusyn (9.7%, a difference of 0.48%).
| Demographics | Rating | Rank | Seniors Poverty Over the Age of 65 |
| Eastern Europeans | 99.6 /100 | #43 | Exceptional 9.6% |
| Austrians | 99.5 /100 | #44 | Exceptional 9.6% |
| Estonians | 99.5 /100 | #45 | Exceptional 9.6% |
| Immigrants | Taiwan | 99.5 /100 | #46 | Exceptional 9.7% |
| Immigrants | South Central Asia | 99.5 /100 | #47 | Exceptional 9.7% |
| French | 99.5 /100 | #48 | Exceptional 9.7% |
| Immigrants | Lithuania | 99.4 /100 | #49 | Exceptional 9.7% |
| Hungarians | 99.4 /100 | #50 | Exceptional 9.7% |
| Carpatho Rusyns | 99.3 /100 | #51 | Exceptional 9.7% |
| Filipinos | 99.3 /100 | #52 | Exceptional 9.7% |
| Slavs | 99.2 /100 | #53 | Exceptional 9.8% |
| Immigrants | Northern Europe | 99.2 /100 | #54 | Exceptional 9.8% |
| Afghans | 99.2 /100 | #55 | Exceptional 9.8% |
| Immigrants | England | 99.1 /100 | #56 | Exceptional 9.8% |
| Bolivians | 99.1 /100 | #57 | Exceptional 9.8% |
Demographics Similar to Armenians by Seniors Poverty Over the Age of 65
In terms of seniors poverty over the age of 65, the demographic groups most similar to Armenians are Somali (12.3%, a difference of 0.11%), Shoshone (12.3%, a difference of 0.13%), Immigrants from Cambodia (12.4%, a difference of 0.35%), Mexican American Indian (12.4%, a difference of 0.48%), and Immigrants from Panama (12.4%, a difference of 0.71%).
| Demographics | Rating | Rank | Seniors Poverty Over the Age of 65 |
| Chippewa | 0.7 /100 | #245 | Tragic 12.1% |
| Cree | 0.7 /100 | #246 | Tragic 12.1% |
| Japanese | 0.6 /100 | #247 | Tragic 12.2% |
| Spanish Americans | 0.6 /100 | #248 | Tragic 12.2% |
| Ute | 0.6 /100 | #249 | Tragic 12.2% |
| Immigrants | Liberia | 0.5 /100 | #250 | Tragic 12.2% |
| Somalis | 0.3 /100 | #251 | Tragic 12.3% |
| Armenians | 0.3 /100 | #252 | Tragic 12.3% |
| Shoshone | 0.3 /100 | #253 | Tragic 12.3% |
| Immigrants | Cambodia | 0.3 /100 | #254 | Tragic 12.4% |
| Mexican American Indians | 0.3 /100 | #255 | Tragic 12.4% |
| Immigrants | Panama | 0.2 /100 | #256 | Tragic 12.4% |
| Immigrants | Immigrants | 0.2 /100 | #257 | Tragic 12.4% |
| Dutch West Indians | 0.2 /100 | #258 | Tragic 12.4% |
| Ghanaians | 0.2 /100 | #259 | Tragic 12.4% |