Hungarian vs Armenian 10th Grade
COMPARE
Hungarian
Armenian
10th Grade
10th Grade Comparison
Hungarians
Armenians
95.3%
10TH GRADE
100.0/ 100
METRIC RATING
32nd/ 347
METRIC RANK
92.7%
10TH GRADE
0.9/ 100
METRIC RATING
254th/ 347
METRIC RANK
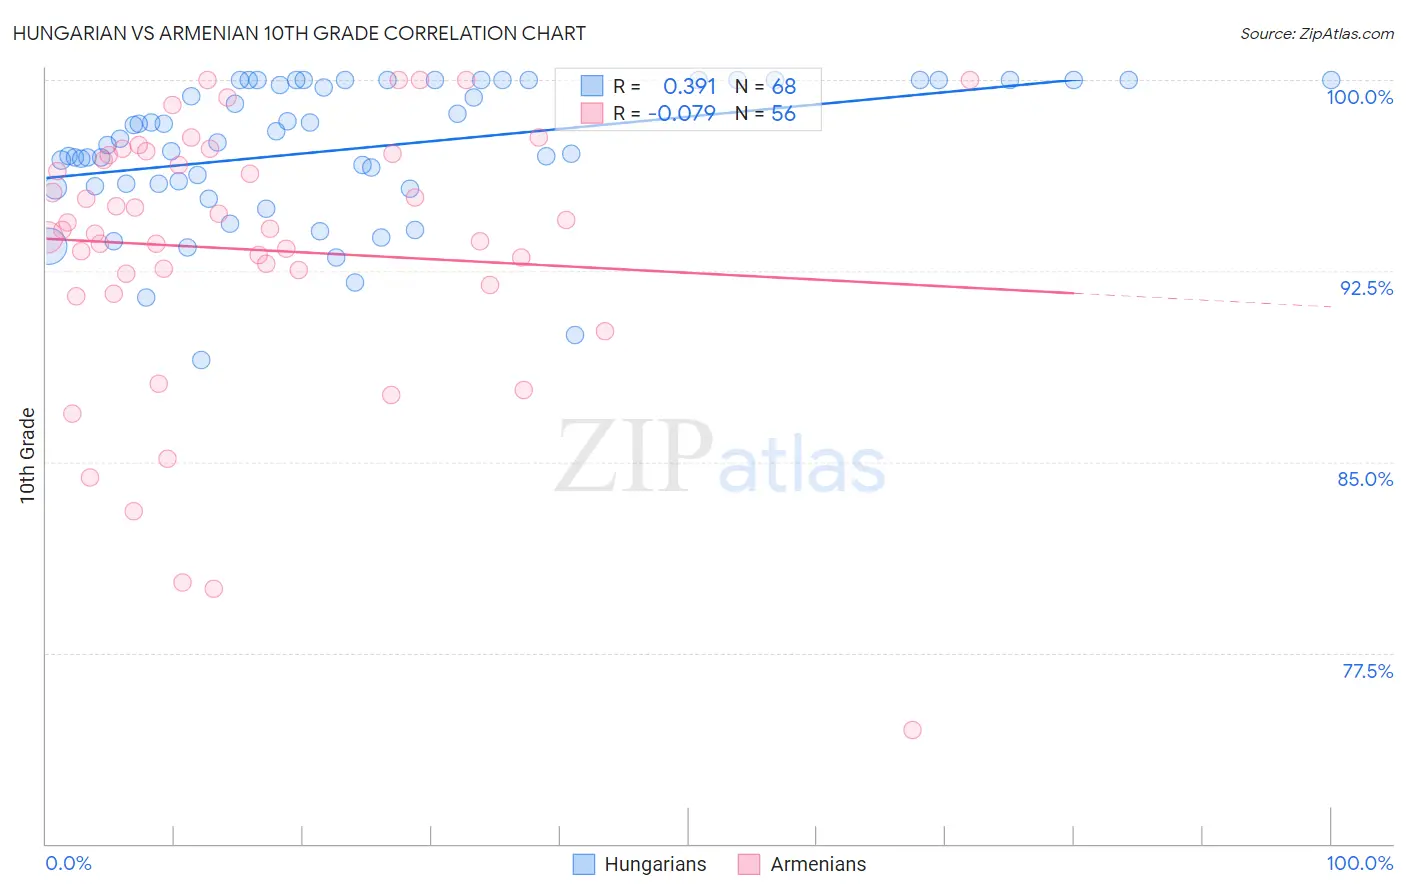
Hungarian vs Armenian 10th Grade Correlation Chart
The statistical analysis conducted on geographies consisting of 486,239,864 people shows a mild positive correlation between the proportion of Hungarians and percentage of population with at least 10th grade education in the United States with a correlation coefficient (R) of 0.391 and weighted average of 95.3%. Similarly, the statistical analysis conducted on geographies consisting of 310,954,685 people shows a slight negative correlation between the proportion of Armenians and percentage of population with at least 10th grade education in the United States with a correlation coefficient (R) of -0.079 and weighted average of 92.7%, a difference of 2.8%.
10th Grade Correlation Summary
| Measurement | Hungarian | Armenian |
| Minimum | 89.0% | 74.5% |
| Maximum | 100.0% | 100.0% |
| Range | 11.0% | 25.5% |
| Mean | 97.3% | 93.3% |
| Median | 97.6% | 94.1% |
| Interquartile 25% (IQ1) | 95.9% | 92.2% |
| Interquartile 75% (IQ3) | 100.0% | 97.1% |
| Interquartile Range (IQR) | 4.1% | 4.9% |
| Standard Deviation (Sample) | 2.7% | 5.4% |
| Standard Deviation (Population) | 2.7% | 5.3% |
Similar Demographics by 10th Grade
Demographics Similar to Hungarians by 10th Grade
In terms of 10th grade, the demographic groups most similar to Hungarians are Iranian (95.3%, a difference of 0.0%), French (95.3%, a difference of 0.0%), British (95.3%, a difference of 0.010%), Belgian (95.4%, a difference of 0.020%), and Estonian (95.3%, a difference of 0.020%).
| Demographics | Rating | Rank | 10th Grade |
| Maltese | 100.0 /100 | #25 | Exceptional 95.5% |
| Welsh | 100.0 /100 | #26 | Exceptional 95.5% |
| Alaskan Athabascans | 100.0 /100 | #27 | Exceptional 95.4% |
| Luxembourgers | 100.0 /100 | #28 | Exceptional 95.4% |
| Bulgarians | 100.0 /100 | #29 | Exceptional 95.4% |
| Belgians | 100.0 /100 | #30 | Exceptional 95.4% |
| Iranians | 100.0 /100 | #31 | Exceptional 95.3% |
| Hungarians | 100.0 /100 | #32 | Exceptional 95.3% |
| French | 100.0 /100 | #33 | Exceptional 95.3% |
| British | 99.9 /100 | #34 | Exceptional 95.3% |
| Estonians | 99.9 /100 | #35 | Exceptional 95.3% |
| Immigrants | India | 99.9 /100 | #36 | Exceptional 95.3% |
| French Canadians | 99.9 /100 | #37 | Exceptional 95.3% |
| Northern Europeans | 99.9 /100 | #38 | Exceptional 95.3% |
| Immigrants | Scotland | 99.9 /100 | #39 | Exceptional 95.2% |
Demographics Similar to Armenians by 10th Grade
In terms of 10th grade, the demographic groups most similar to Armenians are South American (92.8%, a difference of 0.010%), Ghanaian (92.8%, a difference of 0.010%), Immigrants from Thailand (92.8%, a difference of 0.020%), Immigrants from Bolivia (92.7%, a difference of 0.050%), and Immigrants from Nigeria (92.7%, a difference of 0.060%).
| Demographics | Rating | Rank | 10th Grade |
| Immigrants | Afghanistan | 1.4 /100 | #247 | Tragic 92.8% |
| Colombians | 1.4 /100 | #248 | Tragic 92.8% |
| Immigrants | Senegal | 1.4 /100 | #249 | Tragic 92.8% |
| Jamaicans | 1.2 /100 | #250 | Tragic 92.8% |
| Immigrants | Thailand | 1.0 /100 | #251 | Tragic 92.8% |
| South Americans | 0.9 /100 | #252 | Tragic 92.8% |
| Ghanaians | 0.9 /100 | #253 | Tragic 92.8% |
| Armenians | 0.9 /100 | #254 | Tragic 92.7% |
| Immigrants | Bolivia | 0.7 /100 | #255 | Tragic 92.7% |
| Immigrants | Nigeria | 0.7 /100 | #256 | Tragic 92.7% |
| U.S. Virgin Islanders | 0.7 /100 | #257 | Tragic 92.7% |
| Immigrants | Costa Rica | 0.6 /100 | #258 | Tragic 92.7% |
| Immigrants | Jamaica | 0.5 /100 | #259 | Tragic 92.6% |
| Immigrants | Uzbekistan | 0.5 /100 | #260 | Tragic 92.6% |
| Paiute | 0.4 /100 | #261 | Tragic 92.6% |