Houma vs Immigrants from Kuwait Child Poverty Under the Age of 5
COMPARE
Houma
Immigrants from Kuwait
Child Poverty Under the Age of 5
Child Poverty Under the Age of 5 Comparison
Houma
Immigrants from Kuwait
22.7%
CHILD POVERTY UNDER THE AGE OF 5
0.0/ 100
METRIC RATING
309th/ 347
METRIC RANK
16.0%
CHILD POVERTY UNDER THE AGE OF 5
93.9/ 100
METRIC RATING
114th/ 347
METRIC RANK
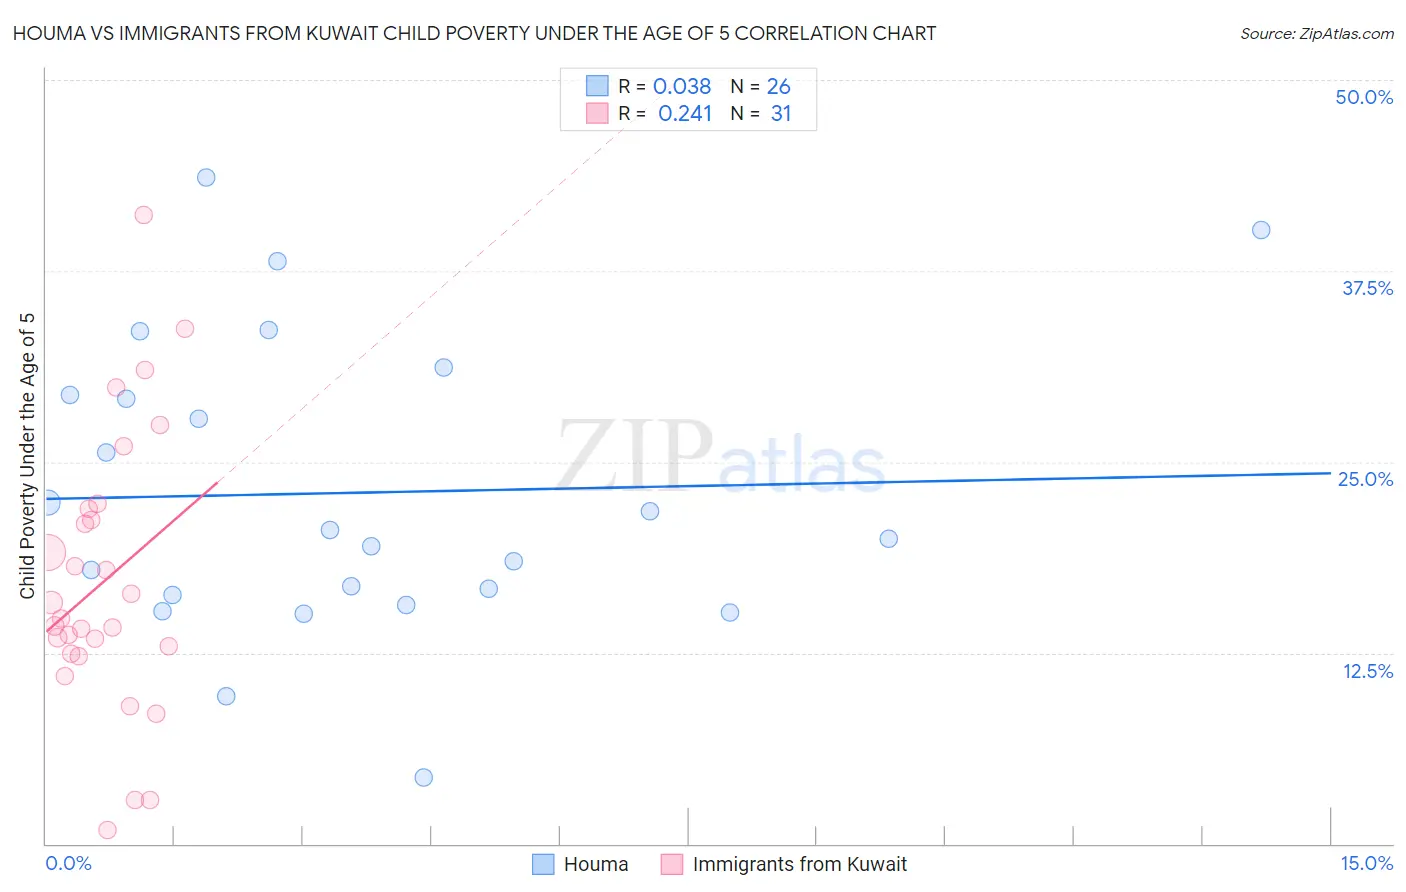
Houma vs Immigrants from Kuwait Child Poverty Under the Age of 5 Correlation Chart
The statistical analysis conducted on geographies consisting of 36,619,572 people shows no correlation between the proportion of Houma and poverty level among children under the age of 5 in the United States with a correlation coefficient (R) of 0.038 and weighted average of 22.7%. Similarly, the statistical analysis conducted on geographies consisting of 134,511,705 people shows a weak positive correlation between the proportion of Immigrants from Kuwait and poverty level among children under the age of 5 in the United States with a correlation coefficient (R) of 0.241 and weighted average of 16.0%, a difference of 41.9%.
Child Poverty Under the Age of 5 Correlation Summary
| Measurement | Houma | Immigrants from Kuwait |
| Minimum | 4.3% | 0.87% |
| Maximum | 43.6% | 41.2% |
| Range | 39.3% | 40.3% |
| Mean | 23.0% | 17.2% |
| Median | 20.3% | 14.7% |
| Interquartile 25% (IQ1) | 16.3% | 12.4% |
| Interquartile 75% (IQ3) | 29.4% | 22.0% |
| Interquartile Range (IQR) | 13.1% | 9.5% |
| Standard Deviation (Sample) | 9.6% | 9.1% |
| Standard Deviation (Population) | 9.4% | 8.9% |
Similar Demographics by Child Poverty Under the Age of 5
Demographics Similar to Houma by Child Poverty Under the Age of 5
In terms of child poverty under the age of 5, the demographic groups most similar to Houma are Immigrants from Dominica (22.7%, a difference of 0.14%), Immigrants from Bahamas (22.7%, a difference of 0.18%), African (22.8%, a difference of 0.41%), Seminole (22.8%, a difference of 0.45%), and Honduran (23.0%, a difference of 1.1%).
| Demographics | Rating | Rank | Child Poverty Under the Age of 5 |
| Iroquois | 0.0 /100 | #302 | Tragic 22.0% |
| Inupiat | 0.0 /100 | #303 | Tragic 22.0% |
| Immigrants | Guatemala | 0.0 /100 | #304 | Tragic 22.0% |
| Immigrants | Mexico | 0.0 /100 | #305 | Tragic 22.2% |
| Indonesians | 0.0 /100 | #306 | Tragic 22.3% |
| Immigrants | Bahamas | 0.0 /100 | #307 | Tragic 22.7% |
| Immigrants | Dominica | 0.0 /100 | #308 | Tragic 22.7% |
| Houma | 0.0 /100 | #309 | Tragic 22.7% |
| Africans | 0.0 /100 | #310 | Tragic 22.8% |
| Seminole | 0.0 /100 | #311 | Tragic 22.8% |
| Hondurans | 0.0 /100 | #312 | Tragic 23.0% |
| Bahamians | 0.0 /100 | #313 | Tragic 23.0% |
| U.S. Virgin Islanders | 0.0 /100 | #314 | Tragic 23.0% |
| Arapaho | 0.0 /100 | #315 | Tragic 23.1% |
| Yakama | 0.0 /100 | #316 | Tragic 23.1% |
Demographics Similar to Immigrants from Kuwait by Child Poverty Under the Age of 5
In terms of child poverty under the age of 5, the demographic groups most similar to Immigrants from Kuwait are Albanian (16.0%, a difference of 0.020%), Peruvian (16.0%, a difference of 0.090%), Puget Sound Salish (16.0%, a difference of 0.090%), Pakistani (16.0%, a difference of 0.15%), and Romanian (16.0%, a difference of 0.18%).
| Demographics | Rating | Rank | Child Poverty Under the Age of 5 |
| Slovenes | 94.4 /100 | #107 | Exceptional 16.0% |
| Immigrants | Brazil | 94.4 /100 | #108 | Exceptional 16.0% |
| Northern Europeans | 94.3 /100 | #109 | Exceptional 16.0% |
| Romanians | 94.3 /100 | #110 | Exceptional 16.0% |
| Pakistanis | 94.2 /100 | #111 | Exceptional 16.0% |
| Peruvians | 94.1 /100 | #112 | Exceptional 16.0% |
| Puget Sound Salish | 94.1 /100 | #113 | Exceptional 16.0% |
| Immigrants | Kuwait | 93.9 /100 | #114 | Exceptional 16.0% |
| Albanians | 93.8 /100 | #115 | Exceptional 16.0% |
| Immigrants | Austria | 93.5 /100 | #116 | Exceptional 16.0% |
| Basques | 93.4 /100 | #117 | Exceptional 16.0% |
| Immigrants | Denmark | 93.4 /100 | #118 | Exceptional 16.0% |
| Immigrants | Jordan | 93.2 /100 | #119 | Exceptional 16.1% |
| Immigrants | Peru | 92.6 /100 | #120 | Exceptional 16.1% |
| Mongolians | 92.5 /100 | #121 | Exceptional 16.1% |