Dominican vs Immigrants from Kuwait Child Poverty Under the Age of 5
COMPARE
Dominican
Immigrants from Kuwait
Child Poverty Under the Age of 5
Child Poverty Under the Age of 5 Comparison
Dominicans
Immigrants from Kuwait
24.0%
CHILD POVERTY UNDER THE AGE OF 5
0.0/ 100
METRIC RATING
327th/ 347
METRIC RANK
16.0%
CHILD POVERTY UNDER THE AGE OF 5
93.9/ 100
METRIC RATING
114th/ 347
METRIC RANK
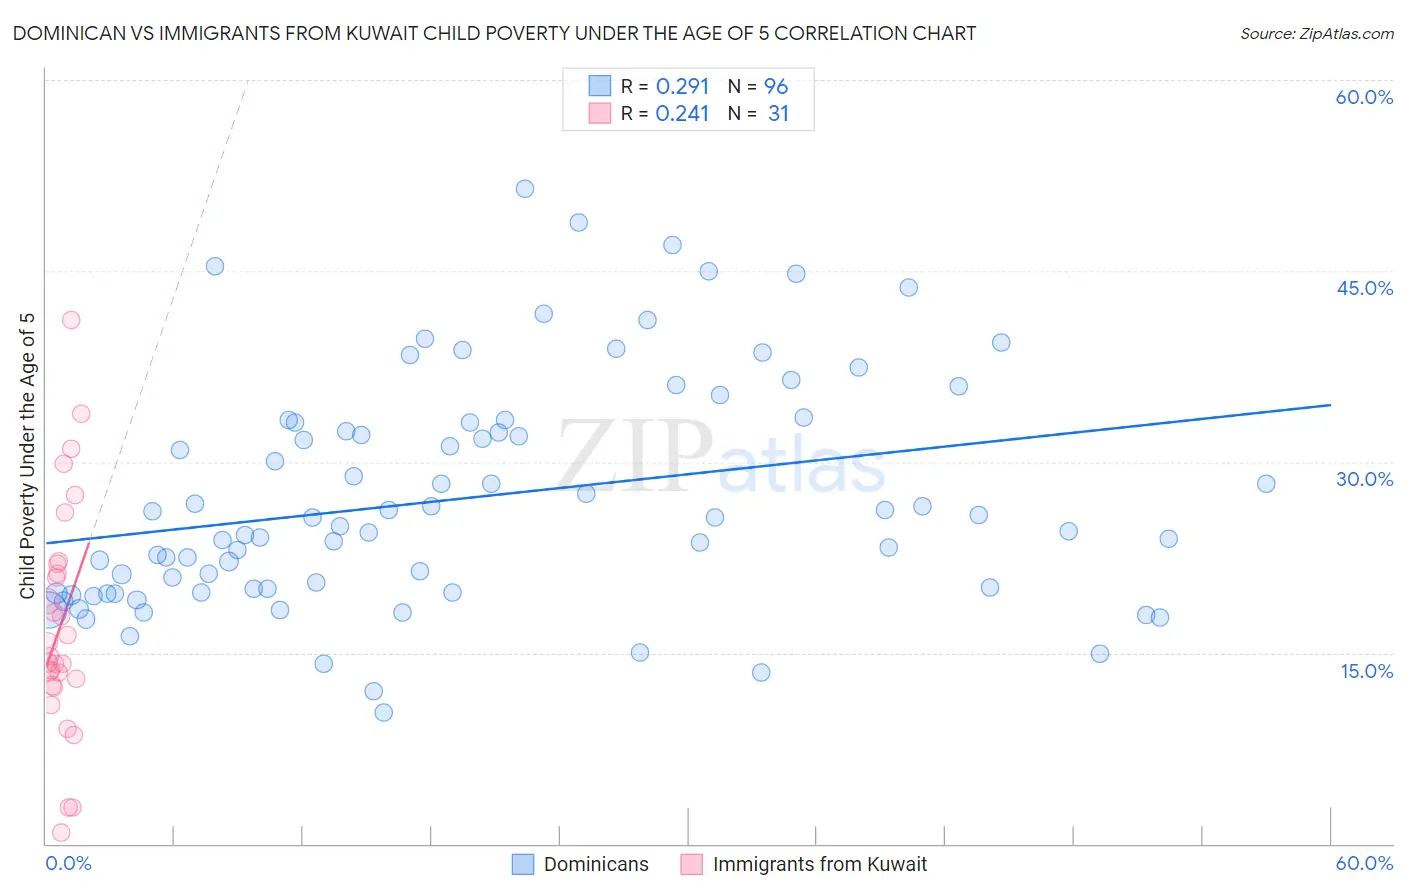
Dominican vs Immigrants from Kuwait Child Poverty Under the Age of 5 Correlation Chart
The statistical analysis conducted on geographies consisting of 342,515,454 people shows a weak positive correlation between the proportion of Dominicans and poverty level among children under the age of 5 in the United States with a correlation coefficient (R) of 0.291 and weighted average of 24.0%. Similarly, the statistical analysis conducted on geographies consisting of 134,511,705 people shows a weak positive correlation between the proportion of Immigrants from Kuwait and poverty level among children under the age of 5 in the United States with a correlation coefficient (R) of 0.241 and weighted average of 16.0%, a difference of 50.1%.
Child Poverty Under the Age of 5 Correlation Summary
| Measurement | Dominican | Immigrants from Kuwait |
| Minimum | 10.3% | 0.87% |
| Maximum | 51.4% | 41.2% |
| Range | 41.1% | 40.3% |
| Mean | 27.2% | 17.2% |
| Median | 25.2% | 14.7% |
| Interquartile 25% (IQ1) | 19.9% | 12.4% |
| Interquartile 75% (IQ3) | 33.1% | 22.0% |
| Interquartile Range (IQR) | 13.2% | 9.5% |
| Standard Deviation (Sample) | 9.0% | 9.1% |
| Standard Deviation (Population) | 9.0% | 8.9% |
Similar Demographics by Child Poverty Under the Age of 5
Demographics Similar to Dominicans by Child Poverty Under the Age of 5
In terms of child poverty under the age of 5, the demographic groups most similar to Dominicans are Immigrants from Dominican Republic (24.1%, a difference of 0.090%), Cajun (24.1%, a difference of 0.32%), Central American Indian (23.9%, a difference of 0.45%), Immigrants from Congo (23.9%, a difference of 0.64%), and Creek (24.2%, a difference of 0.76%).
| Demographics | Rating | Rank | Child Poverty Under the Age of 5 |
| Choctaw | 0.0 /100 | #320 | Tragic 23.5% |
| Immigrants | Honduras | 0.0 /100 | #321 | Tragic 23.5% |
| Ute | 0.0 /100 | #322 | Tragic 23.5% |
| Pueblo | 0.0 /100 | #323 | Tragic 23.7% |
| Paiute | 0.0 /100 | #324 | Tragic 23.8% |
| Immigrants | Congo | 0.0 /100 | #325 | Tragic 23.9% |
| Central American Indians | 0.0 /100 | #326 | Tragic 23.9% |
| Dominicans | 0.0 /100 | #327 | Tragic 24.0% |
| Immigrants | Dominican Republic | 0.0 /100 | #328 | Tragic 24.1% |
| Cajuns | 0.0 /100 | #329 | Tragic 24.1% |
| Creek | 0.0 /100 | #330 | Tragic 24.2% |
| Kiowa | 0.0 /100 | #331 | Tragic 24.5% |
| Apache | 0.0 /100 | #332 | Tragic 25.0% |
| Natives/Alaskans | 0.0 /100 | #333 | Tragic 25.6% |
| Blacks/African Americans | 0.0 /100 | #334 | Tragic 25.7% |
Demographics Similar to Immigrants from Kuwait by Child Poverty Under the Age of 5
In terms of child poverty under the age of 5, the demographic groups most similar to Immigrants from Kuwait are Albanian (16.0%, a difference of 0.020%), Peruvian (16.0%, a difference of 0.090%), Puget Sound Salish (16.0%, a difference of 0.090%), Pakistani (16.0%, a difference of 0.15%), and Romanian (16.0%, a difference of 0.18%).
| Demographics | Rating | Rank | Child Poverty Under the Age of 5 |
| Slovenes | 94.4 /100 | #107 | Exceptional 16.0% |
| Immigrants | Brazil | 94.4 /100 | #108 | Exceptional 16.0% |
| Northern Europeans | 94.3 /100 | #109 | Exceptional 16.0% |
| Romanians | 94.3 /100 | #110 | Exceptional 16.0% |
| Pakistanis | 94.2 /100 | #111 | Exceptional 16.0% |
| Peruvians | 94.1 /100 | #112 | Exceptional 16.0% |
| Puget Sound Salish | 94.1 /100 | #113 | Exceptional 16.0% |
| Immigrants | Kuwait | 93.9 /100 | #114 | Exceptional 16.0% |
| Albanians | 93.8 /100 | #115 | Exceptional 16.0% |
| Immigrants | Austria | 93.5 /100 | #116 | Exceptional 16.0% |
| Basques | 93.4 /100 | #117 | Exceptional 16.0% |
| Immigrants | Denmark | 93.4 /100 | #118 | Exceptional 16.0% |
| Immigrants | Jordan | 93.2 /100 | #119 | Exceptional 16.1% |
| Immigrants | Peru | 92.6 /100 | #120 | Exceptional 16.1% |
| Mongolians | 92.5 /100 | #121 | Exceptional 16.1% |