Houma vs Immigrants from Sweden Child Poverty Under the Age of 5
COMPARE
Houma
Immigrants from Sweden
Child Poverty Under the Age of 5
Child Poverty Under the Age of 5 Comparison
Houma
Immigrants from Sweden
22.7%
CHILD POVERTY UNDER THE AGE OF 5
0.0/ 100
METRIC RATING
309th/ 347
METRIC RANK
15.3%
CHILD POVERTY UNDER THE AGE OF 5
98.8/ 100
METRIC RATING
72nd/ 347
METRIC RANK
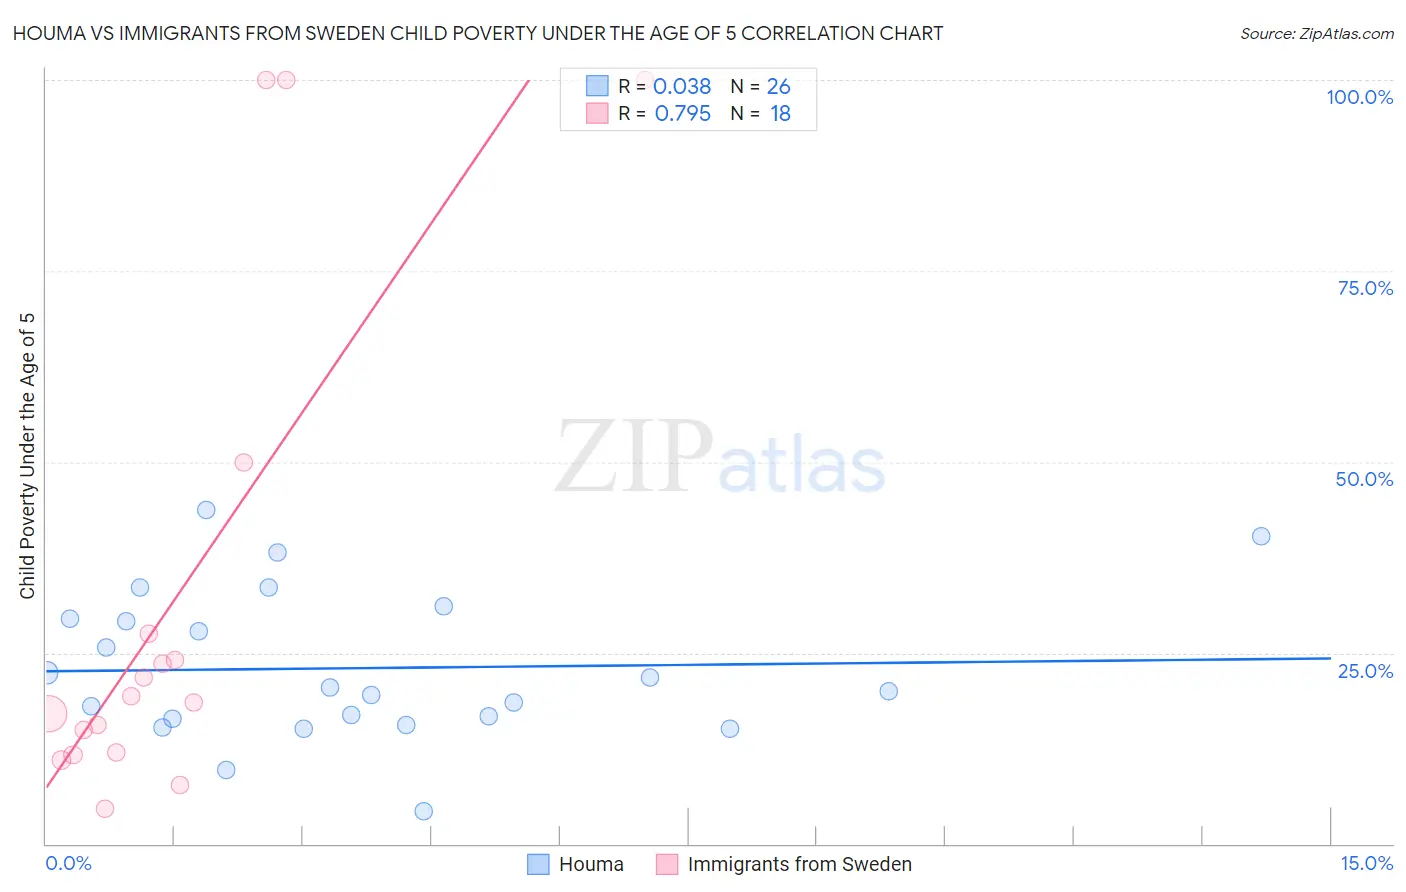
Houma vs Immigrants from Sweden Child Poverty Under the Age of 5 Correlation Chart
The statistical analysis conducted on geographies consisting of 36,619,572 people shows no correlation between the proportion of Houma and poverty level among children under the age of 5 in the United States with a correlation coefficient (R) of 0.038 and weighted average of 22.7%. Similarly, the statistical analysis conducted on geographies consisting of 159,371,189 people shows a strong positive correlation between the proportion of Immigrants from Sweden and poverty level among children under the age of 5 in the United States with a correlation coefficient (R) of 0.795 and weighted average of 15.3%, a difference of 48.9%.
Child Poverty Under the Age of 5 Correlation Summary
| Measurement | Houma | Immigrants from Sweden |
| Minimum | 4.3% | 4.7% |
| Maximum | 43.6% | 100.0% |
| Range | 39.3% | 95.3% |
| Mean | 23.0% | 32.2% |
| Median | 20.3% | 18.9% |
| Interquartile 25% (IQ1) | 16.3% | 12.0% |
| Interquartile 75% (IQ3) | 29.4% | 27.5% |
| Interquartile Range (IQR) | 13.1% | 15.4% |
| Standard Deviation (Sample) | 9.6% | 32.7% |
| Standard Deviation (Population) | 9.4% | 31.8% |
Similar Demographics by Child Poverty Under the Age of 5
Demographics Similar to Houma by Child Poverty Under the Age of 5
In terms of child poverty under the age of 5, the demographic groups most similar to Houma are Immigrants from Dominica (22.7%, a difference of 0.14%), Immigrants from Bahamas (22.7%, a difference of 0.18%), African (22.8%, a difference of 0.41%), Seminole (22.8%, a difference of 0.45%), and Honduran (23.0%, a difference of 1.1%).
| Demographics | Rating | Rank | Child Poverty Under the Age of 5 |
| Iroquois | 0.0 /100 | #302 | Tragic 22.0% |
| Inupiat | 0.0 /100 | #303 | Tragic 22.0% |
| Immigrants | Guatemala | 0.0 /100 | #304 | Tragic 22.0% |
| Immigrants | Mexico | 0.0 /100 | #305 | Tragic 22.2% |
| Indonesians | 0.0 /100 | #306 | Tragic 22.3% |
| Immigrants | Bahamas | 0.0 /100 | #307 | Tragic 22.7% |
| Immigrants | Dominica | 0.0 /100 | #308 | Tragic 22.7% |
| Houma | 0.0 /100 | #309 | Tragic 22.7% |
| Africans | 0.0 /100 | #310 | Tragic 22.8% |
| Seminole | 0.0 /100 | #311 | Tragic 22.8% |
| Hondurans | 0.0 /100 | #312 | Tragic 23.0% |
| Bahamians | 0.0 /100 | #313 | Tragic 23.0% |
| U.S. Virgin Islanders | 0.0 /100 | #314 | Tragic 23.0% |
| Arapaho | 0.0 /100 | #315 | Tragic 23.1% |
| Yakama | 0.0 /100 | #316 | Tragic 23.1% |
Demographics Similar to Immigrants from Sweden by Child Poverty Under the Age of 5
In terms of child poverty under the age of 5, the demographic groups most similar to Immigrants from Sweden are Immigrants from Belgium (15.3%, a difference of 0.070%), Immigrants from Egypt (15.3%, a difference of 0.070%), Immigrants from Ukraine (15.3%, a difference of 0.23%), Lithuanian (15.2%, a difference of 0.50%), and Greek (15.2%, a difference of 0.52%).
| Demographics | Rating | Rank | Child Poverty Under the Age of 5 |
| Immigrants | Fiji | 99.0 /100 | #65 | Exceptional 15.2% |
| Immigrants | Scotland | 99.0 /100 | #66 | Exceptional 15.2% |
| Greeks | 99.0 /100 | #67 | Exceptional 15.2% |
| Zimbabweans | 99.0 /100 | #68 | Exceptional 15.2% |
| Lithuanians | 99.0 /100 | #69 | Exceptional 15.2% |
| Immigrants | Belgium | 98.8 /100 | #70 | Exceptional 15.3% |
| Immigrants | Egypt | 98.8 /100 | #71 | Exceptional 15.3% |
| Immigrants | Sweden | 98.8 /100 | #72 | Exceptional 15.3% |
| Immigrants | Ukraine | 98.7 /100 | #73 | Exceptional 15.3% |
| Argentineans | 98.5 /100 | #74 | Exceptional 15.4% |
| Immigrants | Argentina | 98.5 /100 | #75 | Exceptional 15.4% |
| Croatians | 98.5 /100 | #76 | Exceptional 15.4% |
| Immigrants | Turkey | 98.3 /100 | #77 | Exceptional 15.4% |
| Sri Lankans | 98.1 /100 | #78 | Exceptional 15.5% |
| Australians | 98.0 /100 | #79 | Exceptional 15.5% |