Italian vs Immigrants from Kuwait Child Poverty Under the Age of 5
COMPARE
Italian
Immigrants from Kuwait
Child Poverty Under the Age of 5
Child Poverty Under the Age of 5 Comparison
Italians
Immigrants from Kuwait
15.5%
CHILD POVERTY UNDER THE AGE OF 5
97.9/ 100
METRIC RATING
80th/ 347
METRIC RANK
16.0%
CHILD POVERTY UNDER THE AGE OF 5
93.9/ 100
METRIC RATING
114th/ 347
METRIC RANK
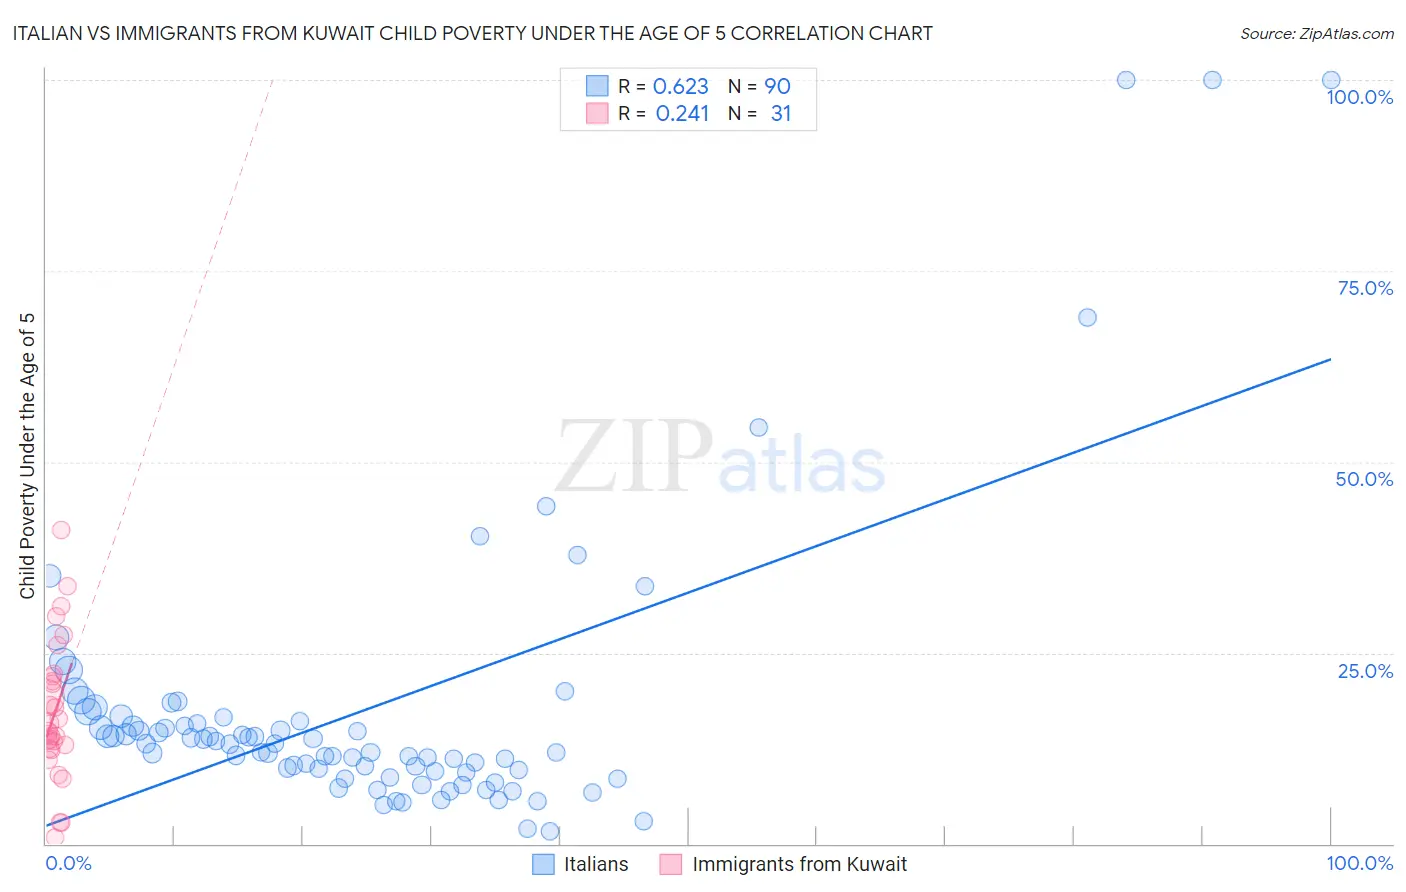
Italian vs Immigrants from Kuwait Child Poverty Under the Age of 5 Correlation Chart
The statistical analysis conducted on geographies consisting of 533,440,321 people shows a significant positive correlation between the proportion of Italians and poverty level among children under the age of 5 in the United States with a correlation coefficient (R) of 0.623 and weighted average of 15.5%. Similarly, the statistical analysis conducted on geographies consisting of 134,511,705 people shows a weak positive correlation between the proportion of Immigrants from Kuwait and poverty level among children under the age of 5 in the United States with a correlation coefficient (R) of 0.241 and weighted average of 16.0%, a difference of 3.2%.
Child Poverty Under the Age of 5 Correlation Summary
| Measurement | Italian | Immigrants from Kuwait |
| Minimum | 1.6% | 0.87% |
| Maximum | 100.0% | 41.2% |
| Range | 98.4% | 40.3% |
| Mean | 17.5% | 17.2% |
| Median | 13.0% | 14.7% |
| Interquartile 25% (IQ1) | 9.6% | 12.4% |
| Interquartile 75% (IQ3) | 16.0% | 22.0% |
| Interquartile Range (IQR) | 6.4% | 9.5% |
| Standard Deviation (Sample) | 18.6% | 9.1% |
| Standard Deviation (Population) | 18.5% | 8.9% |
Similar Demographics by Child Poverty Under the Age of 5
Demographics Similar to Italians by Child Poverty Under the Age of 5
In terms of child poverty under the age of 5, the demographic groups most similar to Italians are Australian (15.5%, a difference of 0.11%), Czech (15.5%, a difference of 0.11%), Immigrants from Italy (15.6%, a difference of 0.25%), Sri Lankan (15.5%, a difference of 0.37%), and Chilean (15.6%, a difference of 0.41%).
| Demographics | Rating | Rank | Child Poverty Under the Age of 5 |
| Immigrants | Ukraine | 98.7 /100 | #73 | Exceptional 15.3% |
| Argentineans | 98.5 /100 | #74 | Exceptional 15.4% |
| Immigrants | Argentina | 98.5 /100 | #75 | Exceptional 15.4% |
| Croatians | 98.5 /100 | #76 | Exceptional 15.4% |
| Immigrants | Turkey | 98.3 /100 | #77 | Exceptional 15.4% |
| Sri Lankans | 98.1 /100 | #78 | Exceptional 15.5% |
| Australians | 98.0 /100 | #79 | Exceptional 15.5% |
| Italians | 97.9 /100 | #80 | Exceptional 15.5% |
| Czechs | 97.8 /100 | #81 | Exceptional 15.5% |
| Immigrants | Italy | 97.7 /100 | #82 | Exceptional 15.6% |
| Chileans | 97.6 /100 | #83 | Exceptional 15.6% |
| Immigrants | Netherlands | 97.6 /100 | #84 | Exceptional 15.6% |
| Immigrants | Latvia | 97.4 /100 | #85 | Exceptional 15.6% |
| Immigrants | Malaysia | 97.4 /100 | #86 | Exceptional 15.6% |
| Immigrants | Vietnam | 97.4 /100 | #87 | Exceptional 15.6% |
Demographics Similar to Immigrants from Kuwait by Child Poverty Under the Age of 5
In terms of child poverty under the age of 5, the demographic groups most similar to Immigrants from Kuwait are Albanian (16.0%, a difference of 0.020%), Peruvian (16.0%, a difference of 0.090%), Puget Sound Salish (16.0%, a difference of 0.090%), Pakistani (16.0%, a difference of 0.15%), and Romanian (16.0%, a difference of 0.18%).
| Demographics | Rating | Rank | Child Poverty Under the Age of 5 |
| Slovenes | 94.4 /100 | #107 | Exceptional 16.0% |
| Immigrants | Brazil | 94.4 /100 | #108 | Exceptional 16.0% |
| Northern Europeans | 94.3 /100 | #109 | Exceptional 16.0% |
| Romanians | 94.3 /100 | #110 | Exceptional 16.0% |
| Pakistanis | 94.2 /100 | #111 | Exceptional 16.0% |
| Peruvians | 94.1 /100 | #112 | Exceptional 16.0% |
| Puget Sound Salish | 94.1 /100 | #113 | Exceptional 16.0% |
| Immigrants | Kuwait | 93.9 /100 | #114 | Exceptional 16.0% |
| Albanians | 93.8 /100 | #115 | Exceptional 16.0% |
| Immigrants | Austria | 93.5 /100 | #116 | Exceptional 16.0% |
| Basques | 93.4 /100 | #117 | Exceptional 16.0% |
| Immigrants | Denmark | 93.4 /100 | #118 | Exceptional 16.0% |
| Immigrants | Jordan | 93.2 /100 | #119 | Exceptional 16.1% |
| Immigrants | Peru | 92.6 /100 | #120 | Exceptional 16.1% |
| Mongolians | 92.5 /100 | #121 | Exceptional 16.1% |