Houma vs Immigrants from Mexico Child Poverty Under the Age of 5
COMPARE
Houma
Immigrants from Mexico
Child Poverty Under the Age of 5
Child Poverty Under the Age of 5 Comparison
Houma
Immigrants from Mexico
22.7%
CHILD POVERTY UNDER THE AGE OF 5
0.0/ 100
METRIC RATING
309th/ 347
METRIC RANK
22.2%
CHILD POVERTY UNDER THE AGE OF 5
0.0/ 100
METRIC RATING
305th/ 347
METRIC RANK
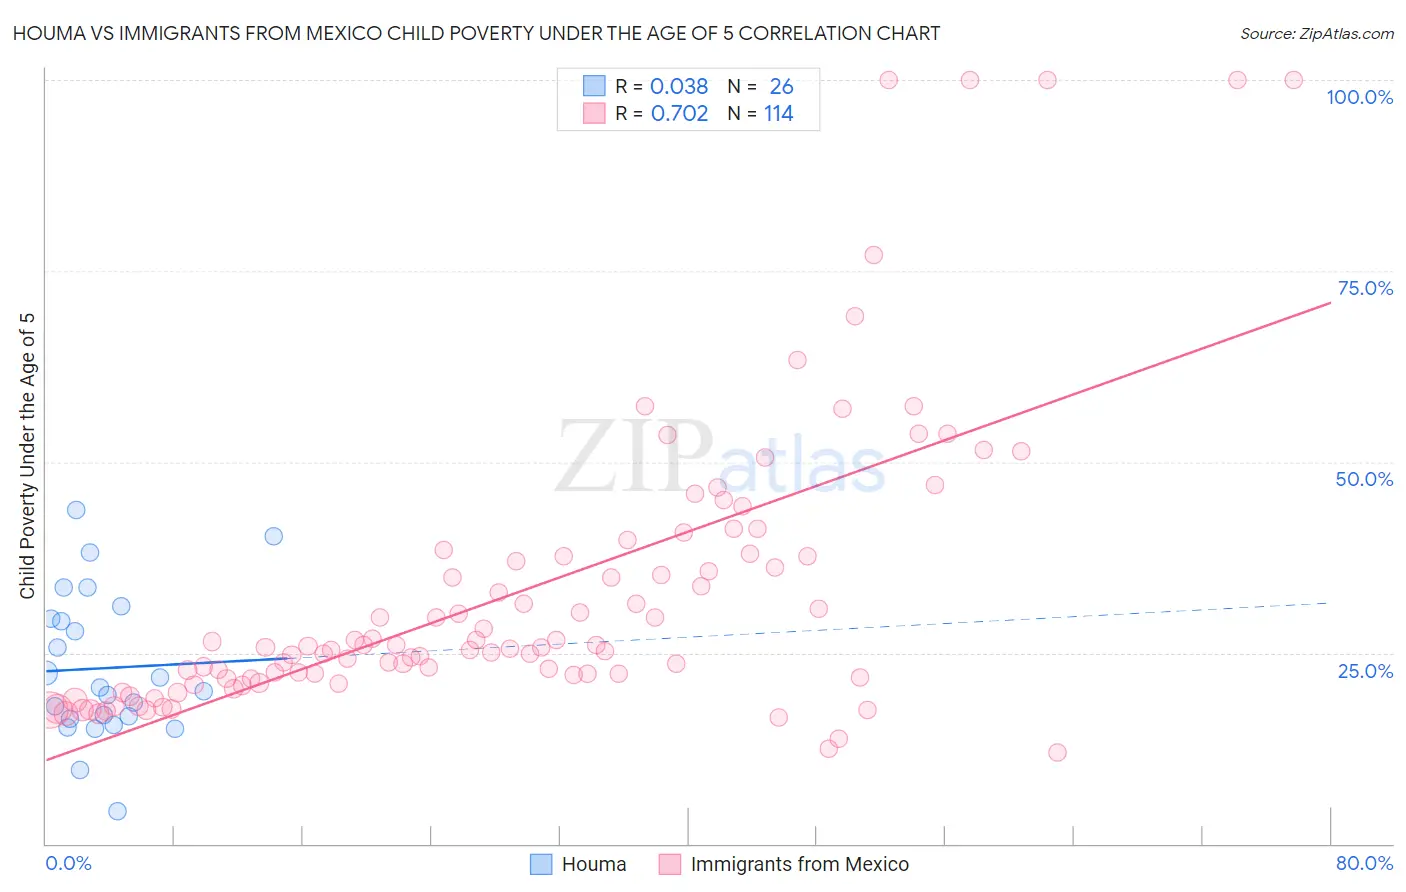
Houma vs Immigrants from Mexico Child Poverty Under the Age of 5 Correlation Chart
The statistical analysis conducted on geographies consisting of 36,619,572 people shows no correlation between the proportion of Houma and poverty level among children under the age of 5 in the United States with a correlation coefficient (R) of 0.038 and weighted average of 22.7%. Similarly, the statistical analysis conducted on geographies consisting of 489,190,038 people shows a strong positive correlation between the proportion of Immigrants from Mexico and poverty level among children under the age of 5 in the United States with a correlation coefficient (R) of 0.702 and weighted average of 22.2%, a difference of 2.2%.
Child Poverty Under the Age of 5 Correlation Summary
| Measurement | Houma | Immigrants from Mexico |
| Minimum | 4.3% | 11.9% |
| Maximum | 43.6% | 100.0% |
| Range | 39.3% | 88.1% |
| Mean | 23.0% | 32.8% |
| Median | 20.3% | 25.8% |
| Interquartile 25% (IQ1) | 16.3% | 21.7% |
| Interquartile 75% (IQ3) | 29.4% | 37.6% |
| Interquartile Range (IQR) | 13.1% | 16.0% |
| Standard Deviation (Sample) | 9.6% | 19.1% |
| Standard Deviation (Population) | 9.4% | 19.0% |
Demographics Similar to Houma and Immigrants from Mexico by Child Poverty Under the Age of 5
In terms of child poverty under the age of 5, the demographic groups most similar to Houma are Immigrants from Dominica (22.7%, a difference of 0.14%), Immigrants from Bahamas (22.7%, a difference of 0.18%), African (22.8%, a difference of 0.41%), Seminole (22.8%, a difference of 0.45%), and Honduran (23.0%, a difference of 1.1%). Similarly, the demographic groups most similar to Immigrants from Mexico are Indonesian (22.3%, a difference of 0.060%), Immigrants from Guatemala (22.0%, a difference of 0.87%), Inupiat (22.0%, a difference of 0.98%), Iroquois (22.0%, a difference of 1.1%), and Immigrants from Central America (22.0%, a difference of 1.2%).
| Demographics | Rating | Rank | Child Poverty Under the Age of 5 |
| Hispanics or Latinos | 0.0 /100 | #297 | Tragic 21.7% |
| Blackfeet | 0.0 /100 | #298 | Tragic 21.8% |
| Chickasaw | 0.0 /100 | #299 | Tragic 21.8% |
| Alaskan Athabascans | 0.0 /100 | #300 | Tragic 21.8% |
| Immigrants | Central America | 0.0 /100 | #301 | Tragic 22.0% |
| Iroquois | 0.0 /100 | #302 | Tragic 22.0% |
| Inupiat | 0.0 /100 | #303 | Tragic 22.0% |
| Immigrants | Guatemala | 0.0 /100 | #304 | Tragic 22.0% |
| Immigrants | Mexico | 0.0 /100 | #305 | Tragic 22.2% |
| Indonesians | 0.0 /100 | #306 | Tragic 22.3% |
| Immigrants | Bahamas | 0.0 /100 | #307 | Tragic 22.7% |
| Immigrants | Dominica | 0.0 /100 | #308 | Tragic 22.7% |
| Houma | 0.0 /100 | #309 | Tragic 22.7% |
| Africans | 0.0 /100 | #310 | Tragic 22.8% |
| Seminole | 0.0 /100 | #311 | Tragic 22.8% |
| Hondurans | 0.0 /100 | #312 | Tragic 23.0% |
| Bahamians | 0.0 /100 | #313 | Tragic 23.0% |
| U.S. Virgin Islanders | 0.0 /100 | #314 | Tragic 23.0% |
| Arapaho | 0.0 /100 | #315 | Tragic 23.1% |
| Yakama | 0.0 /100 | #316 | Tragic 23.1% |
| Menominee | 0.0 /100 | #317 | Tragic 23.3% |