Houma vs Immigrants from Israel 12th Grade, No Diploma
COMPARE
Houma
Immigrants from Israel
12th Grade, No Diploma
12th Grade, No Diploma Comparison
Houma
Immigrants from Israel
83.7%
12TH GRADE, NO DIPLOMA
0.0/ 100
METRIC RATING
342nd/ 347
METRIC RANK
92.5%
12TH GRADE, NO DIPLOMA
99.2/ 100
METRIC RATING
83rd/ 347
METRIC RANK
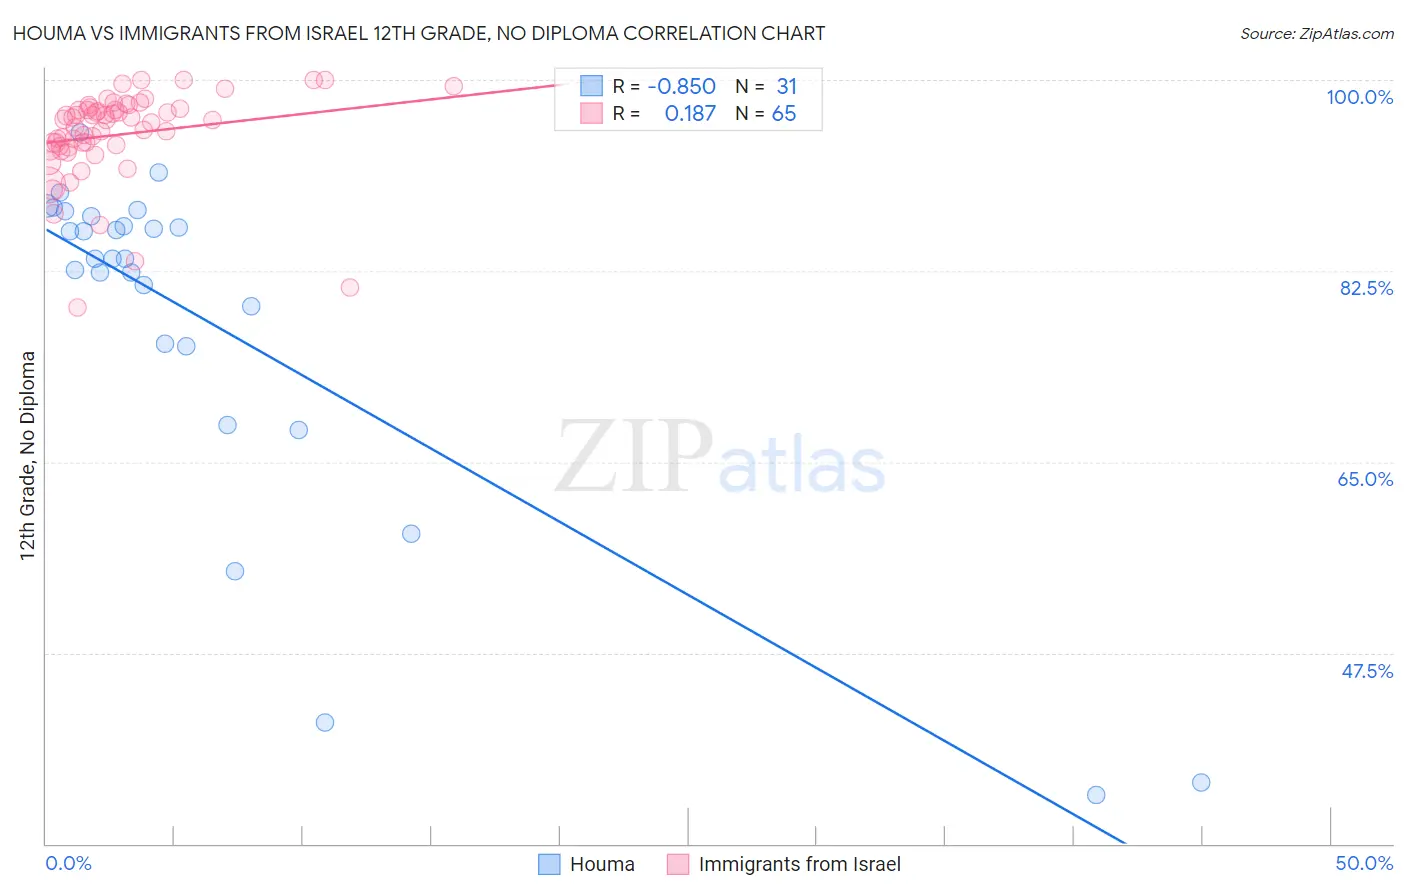
Houma vs Immigrants from Israel 12th Grade, No Diploma Correlation Chart
The statistical analysis conducted on geographies consisting of 36,795,916 people shows a very strong negative correlation between the proportion of Houma and percentage of population with at least 12th grade (no diploma) education in the United States with a correlation coefficient (R) of -0.850 and weighted average of 83.7%. Similarly, the statistical analysis conducted on geographies consisting of 210,029,020 people shows a poor positive correlation between the proportion of Immigrants from Israel and percentage of population with at least 12th grade (no diploma) education in the United States with a correlation coefficient (R) of 0.187 and weighted average of 92.5%, a difference of 10.5%.
12th Grade, No Diploma Correlation Summary
| Measurement | Houma | Immigrants from Israel |
| Minimum | 34.4% | 79.1% |
| Maximum | 95.2% | 100.0% |
| Range | 60.8% | 20.9% |
| Mean | 77.6% | 95.0% |
| Median | 83.7% | 96.3% |
| Interquartile 25% (IQ1) | 75.6% | 93.9% |
| Interquartile 75% (IQ3) | 87.5% | 97.3% |
| Interquartile Range (IQR) | 11.9% | 3.5% |
| Standard Deviation (Sample) | 16.2% | 4.2% |
| Standard Deviation (Population) | 15.9% | 4.1% |
Similar Demographics by 12th Grade, No Diploma
Demographics Similar to Houma by 12th Grade, No Diploma
In terms of 12th grade, no diploma, the demographic groups most similar to Houma are Immigrants from El Salvador (83.6%, a difference of 0.16%), Immigrants from Guatemala (84.0%, a difference of 0.34%), Mexican (84.1%, a difference of 0.48%), Salvadoran (84.5%, a difference of 0.90%), and Immigrants from Central America (83.0%, a difference of 0.90%).
| Demographics | Rating | Rank | 12th Grade, No Diploma |
| Immigrants | Latin America | 0.0 /100 | #333 | Tragic 85.0% |
| Immigrants | Dominican Republic | 0.0 /100 | #334 | Tragic 84.9% |
| Immigrants | Yemen | 0.0 /100 | #335 | Tragic 84.8% |
| Tohono O'odham | 0.0 /100 | #336 | Tragic 84.7% |
| Pima | 0.0 /100 | #337 | Tragic 84.6% |
| Guatemalans | 0.0 /100 | #338 | Tragic 84.6% |
| Salvadorans | 0.0 /100 | #339 | Tragic 84.5% |
| Mexicans | 0.0 /100 | #340 | Tragic 84.1% |
| Immigrants | Guatemala | 0.0 /100 | #341 | Tragic 84.0% |
| Houma | 0.0 /100 | #342 | Tragic 83.7% |
| Immigrants | El Salvador | 0.0 /100 | #343 | Tragic 83.6% |
| Immigrants | Central America | 0.0 /100 | #344 | Tragic 83.0% |
| Spanish American Indians | 0.0 /100 | #345 | Tragic 82.9% |
| Yakama | 0.0 /100 | #346 | Tragic 82.5% |
| Immigrants | Mexico | 0.0 /100 | #347 | Tragic 82.4% |
Demographics Similar to Immigrants from Israel by 12th Grade, No Diploma
In terms of 12th grade, no diploma, the demographic groups most similar to Immigrants from Israel are Immigrants from Denmark (92.5%, a difference of 0.010%), Immigrants from Switzerland (92.5%, a difference of 0.010%), French Canadian (92.6%, a difference of 0.030%), Cambodian (92.6%, a difference of 0.050%), and Romanian (92.6%, a difference of 0.050%).
| Demographics | Rating | Rank | 12th Grade, No Diploma |
| French | 99.4 /100 | #76 | Exceptional 92.6% |
| Immigrants | England | 99.4 /100 | #77 | Exceptional 92.6% |
| Cambodians | 99.3 /100 | #78 | Exceptional 92.6% |
| Romanians | 99.3 /100 | #79 | Exceptional 92.6% |
| French Canadians | 99.3 /100 | #80 | Exceptional 92.6% |
| Immigrants | Denmark | 99.2 /100 | #81 | Exceptional 92.5% |
| Immigrants | Switzerland | 99.2 /100 | #82 | Exceptional 92.5% |
| Immigrants | Israel | 99.2 /100 | #83 | Exceptional 92.5% |
| Immigrants | Bulgaria | 99.1 /100 | #84 | Exceptional 92.5% |
| Immigrants | Saudi Arabia | 99.0 /100 | #85 | Exceptional 92.5% |
| Immigrants | Turkey | 98.9 /100 | #86 | Exceptional 92.4% |
| Immigrants | France | 98.8 /100 | #87 | Exceptional 92.4% |
| Scotch-Irish | 98.8 /100 | #88 | Exceptional 92.4% |
| Canadians | 98.7 /100 | #89 | Exceptional 92.4% |
| Immigrants | Serbia | 98.6 /100 | #90 | Exceptional 92.4% |