Houma vs Finnish Seniors Poverty Over the Age of 65
COMPARE
Houma
Finnish
Seniors Poverty Over the Age of 65
Seniors Poverty Over the Age of 65 Comparison
Houma
Finns
14.7%
SENIORS POVERTY OVER THE AGE OF 65
0.0/ 100
METRIC RATING
321st/ 347
METRIC RANK
9.4%
SENIORS POVERTY OVER THE AGE OF 65
99.8/ 100
METRIC RATING
31st/ 347
METRIC RANK
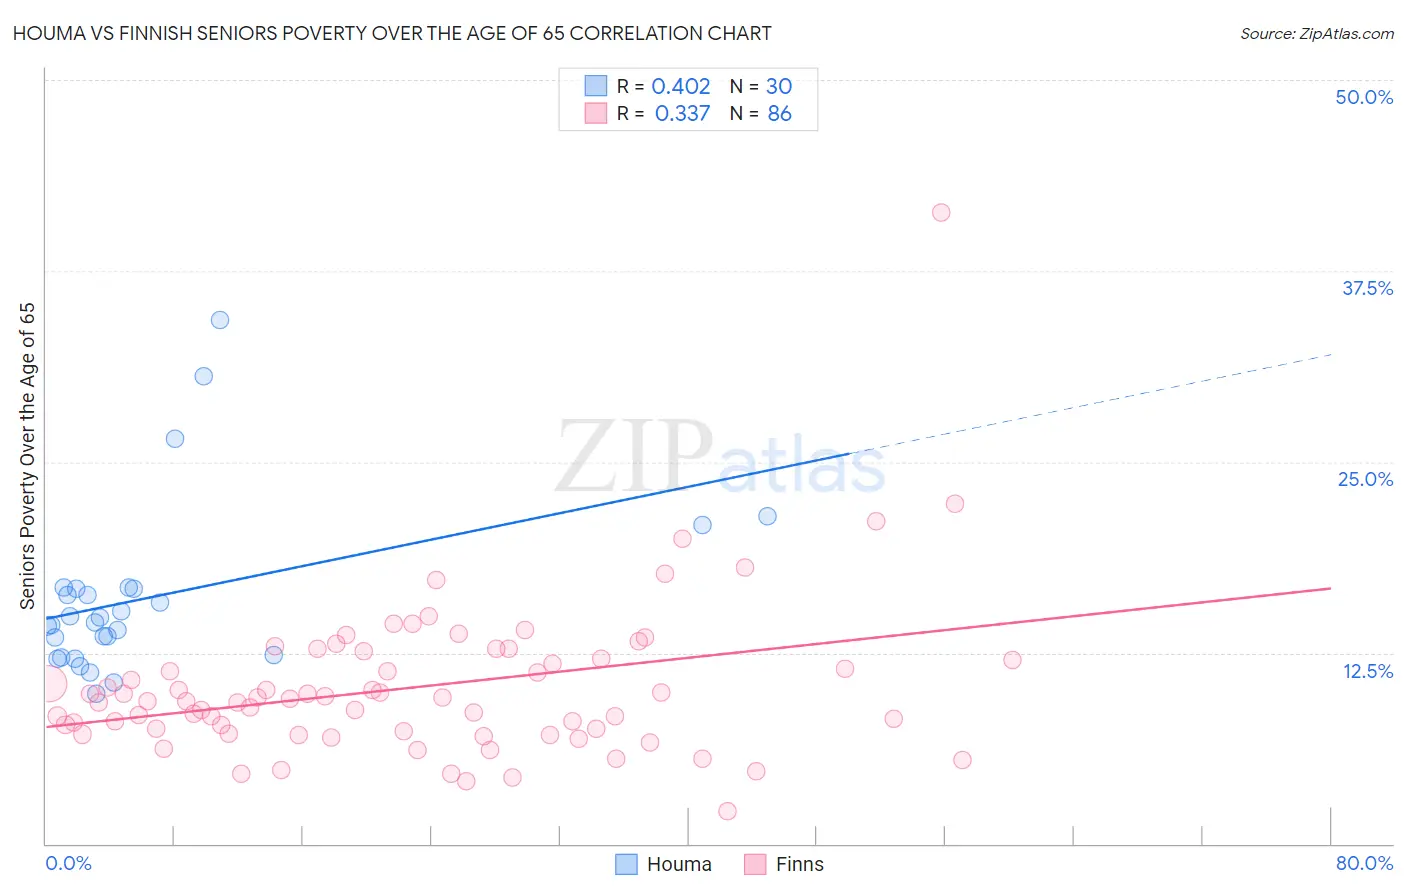
Houma vs Finnish Seniors Poverty Over the Age of 65 Correlation Chart
The statistical analysis conducted on geographies consisting of 36,747,391 people shows a moderate positive correlation between the proportion of Houma and poverty level among seniors over the age of 65 in the United States with a correlation coefficient (R) of 0.402 and weighted average of 14.7%. Similarly, the statistical analysis conducted on geographies consisting of 403,117,006 people shows a mild positive correlation between the proportion of Finns and poverty level among seniors over the age of 65 in the United States with a correlation coefficient (R) of 0.337 and weighted average of 9.4%, a difference of 56.9%.
Seniors Poverty Over the Age of 65 Correlation Summary
| Measurement | Houma | Finnish |
| Minimum | 9.8% | 2.1% |
| Maximum | 34.3% | 41.3% |
| Range | 24.5% | 39.2% |
| Mean | 16.1% | 10.3% |
| Median | 14.6% | 9.4% |
| Interquartile 25% (IQ1) | 12.3% | 7.4% |
| Interquartile 75% (IQ3) | 16.7% | 12.1% |
| Interquartile Range (IQR) | 4.4% | 4.7% |
| Standard Deviation (Sample) | 5.6% | 5.1% |
| Standard Deviation (Population) | 5.5% | 5.1% |
Similar Demographics by Seniors Poverty Over the Age of 65
Demographics Similar to Houma by Seniors Poverty Over the Age of 65
In terms of seniors poverty over the age of 65, the demographic groups most similar to Houma are Immigrants from Haiti (14.7%, a difference of 0.21%), Immigrants from Barbados (14.8%, a difference of 0.38%), Cape Verdean (14.7%, a difference of 0.39%), Yakama (14.8%, a difference of 0.54%), and Immigrants from Honduras (14.5%, a difference of 1.5%).
| Demographics | Rating | Rank | Seniors Poverty Over the Age of 65 |
| Guyanese | 0.0 /100 | #314 | Tragic 14.4% |
| Immigrants | Ecuador | 0.0 /100 | #315 | Tragic 14.4% |
| Immigrants | Guyana | 0.0 /100 | #316 | Tragic 14.5% |
| Haitians | 0.0 /100 | #317 | Tragic 14.5% |
| Immigrants | Honduras | 0.0 /100 | #318 | Tragic 14.5% |
| Cape Verdeans | 0.0 /100 | #319 | Tragic 14.7% |
| Immigrants | Haiti | 0.0 /100 | #320 | Tragic 14.7% |
| Houma | 0.0 /100 | #321 | Tragic 14.7% |
| Immigrants | Barbados | 0.0 /100 | #322 | Tragic 14.8% |
| Yakama | 0.0 /100 | #323 | Tragic 14.8% |
| Nicaraguans | 0.0 /100 | #324 | Tragic 15.0% |
| Central American Indians | 0.0 /100 | #325 | Tragic 15.1% |
| Immigrants | Armenia | 0.0 /100 | #326 | Tragic 15.2% |
| Crow | 0.0 /100 | #327 | Tragic 15.2% |
| Sioux | 0.0 /100 | #328 | Tragic 15.3% |
Demographics Similar to Finns by Seniors Poverty Over the Age of 65
In terms of seniors poverty over the age of 65, the demographic groups most similar to Finns are Menominee (9.4%, a difference of 0.22%), Northern European (9.4%, a difference of 0.28%), Native Hawaiian (9.4%, a difference of 0.30%), Bhutanese (9.3%, a difference of 0.37%), and British (9.4%, a difference of 0.40%).
| Demographics | Rating | Rank | Seniors Poverty Over the Age of 65 |
| Bulgarians | 99.9 /100 | #24 | Exceptional 9.3% |
| Irish | 99.9 /100 | #25 | Exceptional 9.3% |
| Immigrants | Scotland | 99.9 /100 | #26 | Exceptional 9.3% |
| Italians | 99.9 /100 | #27 | Exceptional 9.3% |
| Tongans | 99.9 /100 | #28 | Exceptional 9.3% |
| Bhutanese | 99.9 /100 | #29 | Exceptional 9.3% |
| Menominee | 99.8 /100 | #30 | Exceptional 9.4% |
| Finns | 99.8 /100 | #31 | Exceptional 9.4% |
| Northern Europeans | 99.8 /100 | #32 | Exceptional 9.4% |
| Native Hawaiians | 99.8 /100 | #33 | Exceptional 9.4% |
| British | 99.8 /100 | #34 | Exceptional 9.4% |
| Latvians | 99.8 /100 | #35 | Exceptional 9.5% |
| Czechoslovakians | 99.8 /100 | #36 | Exceptional 9.5% |
| Scotch-Irish | 99.7 /100 | #37 | Exceptional 9.5% |
| Belgians | 99.7 /100 | #38 | Exceptional 9.5% |