Houma vs Finnish Child Poverty Among Boys Under 16
COMPARE
Houma
Finnish
Child Poverty Among Boys Under 16
Child Poverty Among Boys Under 16 Comparison
Houma
Finns
26.2%
CHILD POVERTY AMONG BOYS UNDER 16
0.0/ 100
METRIC RATING
339th/ 347
METRIC RANK
14.9%
CHILD POVERTY AMONG BOYS UNDER 16
96.5/ 100
METRIC RATING
95th/ 347
METRIC RANK
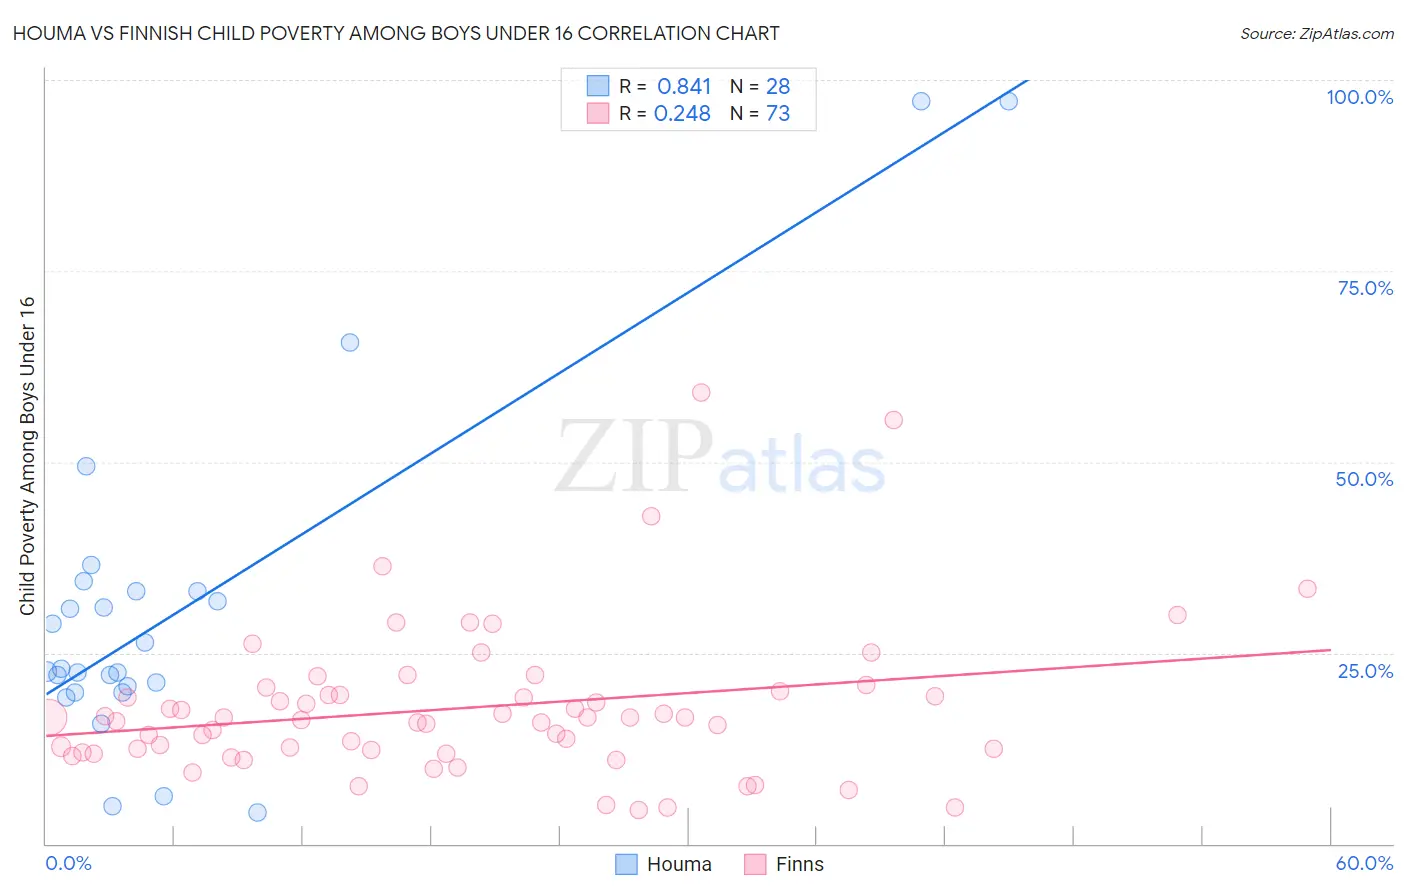
Houma vs Finnish Child Poverty Among Boys Under 16 Correlation Chart
The statistical analysis conducted on geographies consisting of 36,674,950 people shows a very strong positive correlation between the proportion of Houma and poverty level among boys under the age of 16 in the United States with a correlation coefficient (R) of 0.841 and weighted average of 26.2%. Similarly, the statistical analysis conducted on geographies consisting of 396,043,937 people shows a weak positive correlation between the proportion of Finns and poverty level among boys under the age of 16 in the United States with a correlation coefficient (R) of 0.248 and weighted average of 14.9%, a difference of 75.8%.
Child Poverty Among Boys Under 16 Correlation Summary
| Measurement | Houma | Finnish |
| Minimum | 4.0% | 4.4% |
| Maximum | 97.3% | 59.2% |
| Range | 93.2% | 54.8% |
| Mean | 30.8% | 17.8% |
| Median | 22.8% | 16.5% |
| Interquartile 25% (IQ1) | 20.2% | 12.1% |
| Interquartile 75% (IQ3) | 33.1% | 19.7% |
| Interquartile Range (IQR) | 12.9% | 7.6% |
| Standard Deviation (Sample) | 22.5% | 9.9% |
| Standard Deviation (Population) | 22.1% | 9.8% |
Similar Demographics by Child Poverty Among Boys Under 16
Demographics Similar to Houma by Child Poverty Among Boys Under 16
In terms of child poverty among boys under 16, the demographic groups most similar to Houma are Crow (26.3%, a difference of 0.16%), Hopi (25.9%, a difference of 1.0%), Cheyenne (25.8%, a difference of 1.5%), Sioux (25.3%, a difference of 3.6%), and Yup'ik (24.7%, a difference of 6.0%).
| Demographics | Rating | Rank | Child Poverty Among Boys Under 16 |
| Immigrants | Dominican Republic | 0.0 /100 | #332 | Tragic 24.3% |
| Apache | 0.0 /100 | #333 | Tragic 24.5% |
| Blacks/African Americans | 0.0 /100 | #334 | Tragic 24.5% |
| Yup'ik | 0.0 /100 | #335 | Tragic 24.7% |
| Sioux | 0.0 /100 | #336 | Tragic 25.3% |
| Cheyenne | 0.0 /100 | #337 | Tragic 25.8% |
| Hopi | 0.0 /100 | #338 | Tragic 25.9% |
| Houma | 0.0 /100 | #339 | Tragic 26.2% |
| Crow | 0.0 /100 | #340 | Tragic 26.3% |
| Immigrants | Yemen | 0.0 /100 | #341 | Tragic 28.9% |
| Pima | 0.0 /100 | #342 | Tragic 29.7% |
| Navajo | 0.0 /100 | #343 | Tragic 30.3% |
| Yuman | 0.0 /100 | #344 | Tragic 30.6% |
| Tohono O'odham | 0.0 /100 | #345 | Tragic 31.6% |
| Lumbee | 0.0 /100 | #346 | Tragic 31.9% |
Demographics Similar to Finns by Child Poverty Among Boys Under 16
In terms of child poverty among boys under 16, the demographic groups most similar to Finns are Immigrants from Italy (14.9%, a difference of 0.10%), Sri Lankan (14.9%, a difference of 0.11%), Argentinean (14.9%, a difference of 0.16%), Paraguayan (14.9%, a difference of 0.23%), and Immigrants from North Macedonia (14.9%, a difference of 0.25%).
| Demographics | Rating | Rank | Child Poverty Among Boys Under 16 |
| Immigrants | North America | 97.1 /100 | #88 | Exceptional 14.8% |
| Immigrants | Argentina | 97.1 /100 | #89 | Exceptional 14.8% |
| Austrians | 97.1 /100 | #90 | Exceptional 14.8% |
| Paraguayans | 96.8 /100 | #91 | Exceptional 14.9% |
| Argentineans | 96.7 /100 | #92 | Exceptional 14.9% |
| Sri Lankans | 96.7 /100 | #93 | Exceptional 14.9% |
| Immigrants | Italy | 96.7 /100 | #94 | Exceptional 14.9% |
| Finns | 96.5 /100 | #95 | Exceptional 14.9% |
| Immigrants | North Macedonia | 96.3 /100 | #96 | Exceptional 14.9% |
| Immigrants | Egypt | 96.2 /100 | #97 | Exceptional 14.9% |
| British | 96.2 /100 | #98 | Exceptional 15.0% |
| Immigrants | France | 96.1 /100 | #99 | Exceptional 15.0% |
| Chileans | 95.8 /100 | #100 | Exceptional 15.0% |
| Immigrants | Belarus | 95.7 /100 | #101 | Exceptional 15.0% |
| Romanians | 95.6 /100 | #102 | Exceptional 15.0% |