Hopi vs Immigrants from South America Child Poverty Among Girls Under 16
COMPARE
Hopi
Immigrants from South America
Child Poverty Among Girls Under 16
Child Poverty Among Girls Under 16 Comparison
Hopi
Immigrants from South America
27.9%
CHILD POVERTY AMONG GIRLS UNDER 16
0.0/ 100
METRIC RATING
341st/ 347
METRIC RANK
16.4%
CHILD POVERTY AMONG GIRLS UNDER 16
55.1/ 100
METRIC RATING
173rd/ 347
METRIC RANK
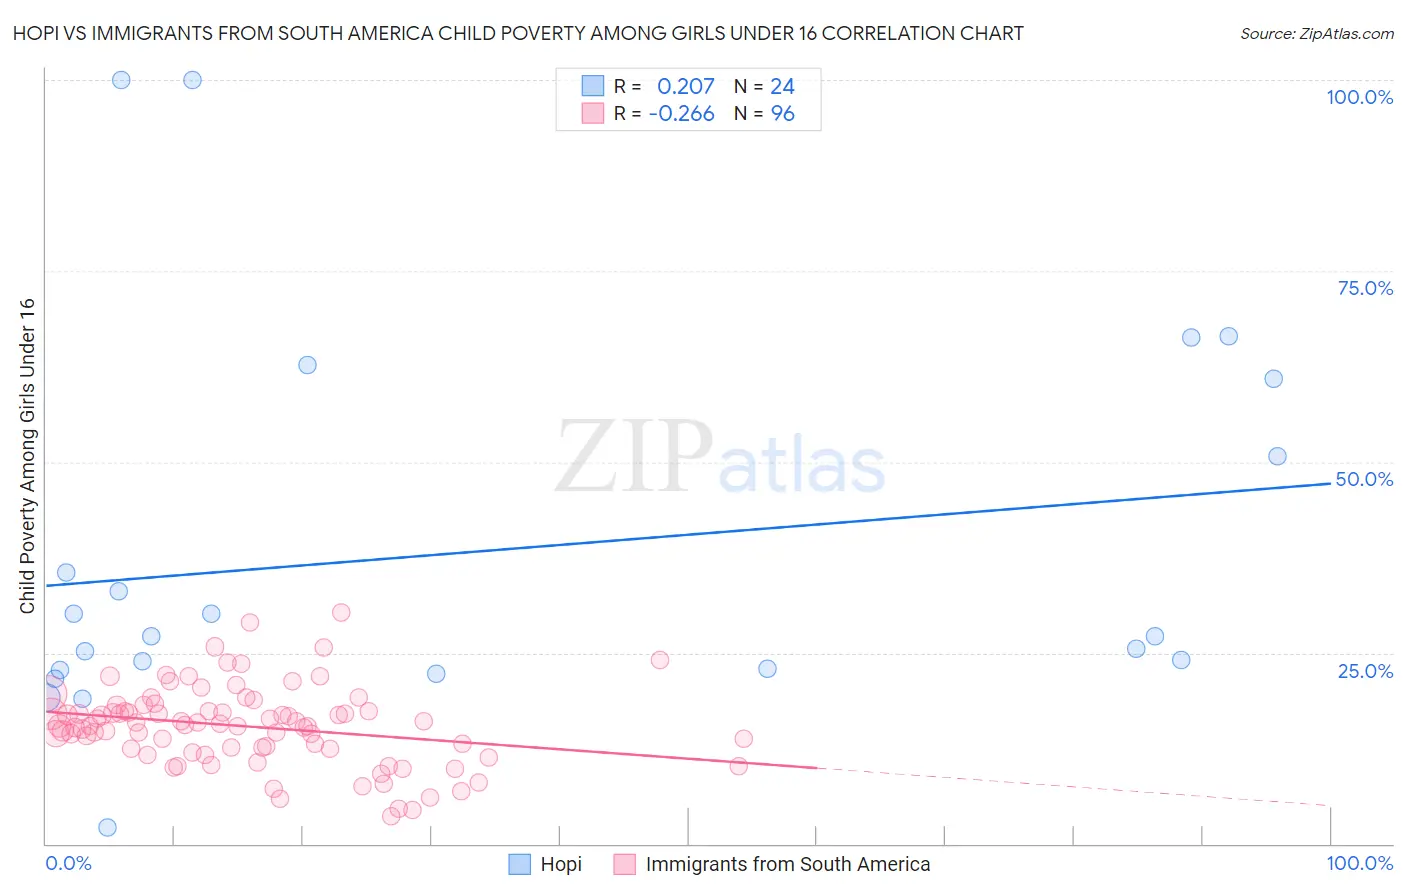
Hopi vs Immigrants from South America Child Poverty Among Girls Under 16 Correlation Chart
The statistical analysis conducted on geographies consisting of 74,572,915 people shows a weak positive correlation between the proportion of Hopi and poverty level among girls under the age of 16 in the United States with a correlation coefficient (R) of 0.207 and weighted average of 27.9%. Similarly, the statistical analysis conducted on geographies consisting of 473,703,980 people shows a weak negative correlation between the proportion of Immigrants from South America and poverty level among girls under the age of 16 in the United States with a correlation coefficient (R) of -0.266 and weighted average of 16.4%, a difference of 70.2%.
Child Poverty Among Girls Under 16 Correlation Summary
| Measurement | Hopi | Immigrants from South America |
| Minimum | 2.1% | 3.7% |
| Maximum | 100.0% | 30.3% |
| Range | 97.9% | 26.7% |
| Mean | 38.3% | 15.4% |
| Median | 27.2% | 15.5% |
| Interquartile 25% (IQ1) | 22.8% | 12.5% |
| Interquartile 75% (IQ3) | 55.8% | 17.4% |
| Interquartile Range (IQR) | 33.0% | 4.9% |
| Standard Deviation (Sample) | 25.3% | 5.2% |
| Standard Deviation (Population) | 24.7% | 5.1% |
Similar Demographics by Child Poverty Among Girls Under 16
Demographics Similar to Hopi by Child Poverty Among Girls Under 16
In terms of child poverty among girls under 16, the demographic groups most similar to Hopi are Pima (28.2%, a difference of 1.3%), Yuman (27.1%, a difference of 2.9%), Crow (26.4%, a difference of 5.7%), Immigrants from Yemen (29.5%, a difference of 5.9%), and Cheyenne (26.3%, a difference of 6.0%).
| Demographics | Rating | Rank | Child Poverty Among Girls Under 16 |
| Blacks/African Americans | 0.0 /100 | #333 | Tragic 24.7% |
| Menominee | 0.0 /100 | #334 | Tragic 25.0% |
| Pueblo | 0.0 /100 | #335 | Tragic 25.2% |
| Sioux | 0.0 /100 | #336 | Tragic 25.6% |
| Yup'ik | 0.0 /100 | #337 | Tragic 25.8% |
| Cheyenne | 0.0 /100 | #338 | Tragic 26.3% |
| Crow | 0.0 /100 | #339 | Tragic 26.4% |
| Yuman | 0.0 /100 | #340 | Tragic 27.1% |
| Hopi | 0.0 /100 | #341 | Tragic 27.9% |
| Pima | 0.0 /100 | #342 | Tragic 28.2% |
| Immigrants | Yemen | 0.0 /100 | #343 | Tragic 29.5% |
| Navajo | 0.0 /100 | #344 | Tragic 30.5% |
| Lumbee | 0.0 /100 | #345 | Tragic 30.7% |
| Tohono O'odham | 0.0 /100 | #346 | Tragic 31.6% |
| Puerto Ricans | 0.0 /100 | #347 | Tragic 32.7% |
Demographics Similar to Immigrants from South America by Child Poverty Among Girls Under 16
In terms of child poverty among girls under 16, the demographic groups most similar to Immigrants from South America are Ethiopian (16.5%, a difference of 0.59%), Afghan (16.2%, a difference of 0.88%), Immigrants from Saudi Arabia (16.2%, a difference of 1.1%), Costa Rican (16.2%, a difference of 1.1%), and Immigrants from Venezuela (16.2%, a difference of 1.1%).
| Demographics | Rating | Rank | Child Poverty Among Girls Under 16 |
| South Americans | 67.2 /100 | #166 | Good 16.1% |
| Uruguayans | 64.7 /100 | #167 | Good 16.2% |
| Yugoslavians | 64.4 /100 | #168 | Good 16.2% |
| Costa Ricans | 64.2 /100 | #169 | Good 16.2% |
| Immigrants | Venezuela | 64.2 /100 | #170 | Good 16.2% |
| Immigrants | Saudi Arabia | 64.0 /100 | #171 | Good 16.2% |
| Afghans | 62.3 /100 | #172 | Good 16.2% |
| Immigrants | South America | 55.1 /100 | #173 | Average 16.4% |
| Ethiopians | 50.0 /100 | #174 | Average 16.5% |
| Lebanese | 45.4 /100 | #175 | Average 16.6% |
| Hungarians | 45.1 /100 | #176 | Average 16.6% |
| Immigrants | Western Asia | 44.1 /100 | #177 | Average 16.6% |
| Whites/Caucasians | 43.6 /100 | #178 | Average 16.6% |
| Hawaiians | 43.4 /100 | #179 | Average 16.6% |
| Immigrants | Syria | 43.3 /100 | #180 | Average 16.6% |