Lebanese vs Carpatho Rusyn Single Father Poverty
COMPARE
Lebanese
Carpatho Rusyn
Single Father Poverty
Single Father Poverty Comparison
Lebanese
Carpatho Rusyns
17.7%
SINGLE FATHER POVERTY
0.0/ 100
METRIC RATING
277th/ 347
METRIC RANK
18.0%
SINGLE FATHER POVERTY
0.0/ 100
METRIC RATING
287th/ 347
METRIC RANK
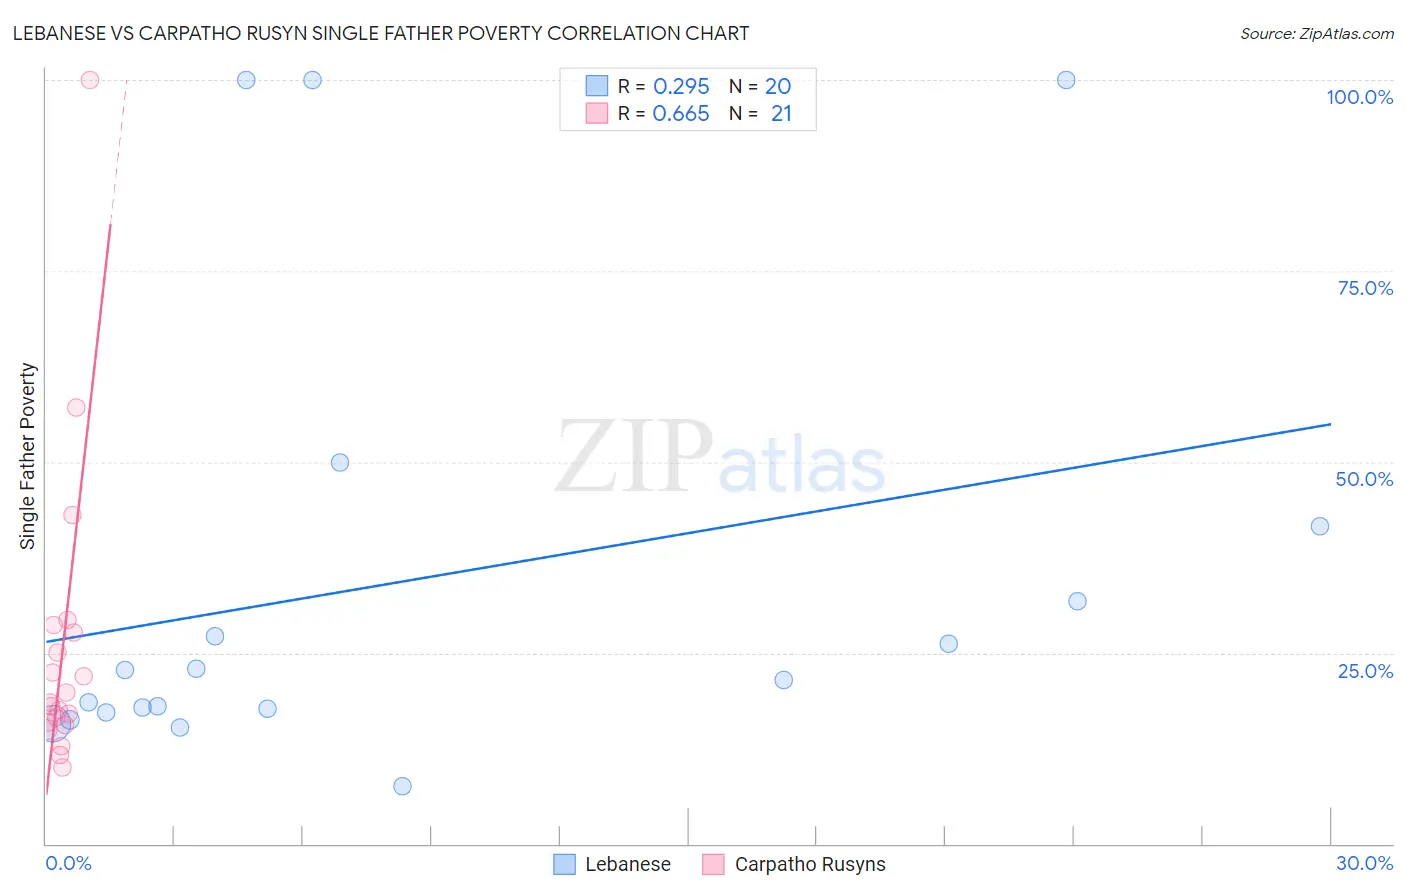
Lebanese vs Carpatho Rusyn Single Father Poverty Correlation Chart
The statistical analysis conducted on geographies consisting of 311,744,378 people shows a weak positive correlation between the proportion of Lebanese and poverty level among single fathers in the United States with a correlation coefficient (R) of 0.295 and weighted average of 17.7%. Similarly, the statistical analysis conducted on geographies consisting of 53,631,013 people shows a significant positive correlation between the proportion of Carpatho Rusyns and poverty level among single fathers in the United States with a correlation coefficient (R) of 0.665 and weighted average of 18.0%, a difference of 1.4%.
Single Father Poverty Correlation Summary
| Measurement | Lebanese | Carpatho Rusyn |
| Minimum | 7.5% | 10.0% |
| Maximum | 100.0% | 100.0% |
| Range | 92.5% | 90.0% |
| Mean | 34.4% | 25.9% |
| Median | 22.2% | 18.6% |
| Interquartile 25% (IQ1) | 17.4% | 15.7% |
| Interquartile 75% (IQ3) | 36.6% | 28.1% |
| Interquartile Range (IQR) | 19.2% | 12.4% |
| Standard Deviation (Sample) | 29.8% | 20.2% |
| Standard Deviation (Population) | 29.1% | 19.7% |
Demographics Similar to Lebanese and Carpatho Rusyns by Single Father Poverty
In terms of single father poverty, the demographic groups most similar to Lebanese are German (17.7%, a difference of 0.010%), German Russian (17.7%, a difference of 0.15%), Iroquois (17.7%, a difference of 0.16%), Scottish (17.7%, a difference of 0.20%), and British West Indian (17.7%, a difference of 0.21%). Similarly, the demographic groups most similar to Carpatho Rusyns are Bahamian (18.0%, a difference of 0.020%), Immigrants from North Macedonia (17.9%, a difference of 0.22%), Immigrants from Lebanon (17.9%, a difference of 0.40%), Irish (18.0%, a difference of 0.46%), and West Indian (18.0%, a difference of 0.49%).
| Demographics | Rating | Rank | Single Father Poverty |
| Barbadians | 0.1 /100 | #272 | Tragic 17.5% |
| Italians | 0.1 /100 | #273 | Tragic 17.5% |
| Macedonians | 0.1 /100 | #274 | Tragic 17.7% |
| British West Indians | 0.0 /100 | #275 | Tragic 17.7% |
| German Russians | 0.0 /100 | #276 | Tragic 17.7% |
| Lebanese | 0.0 /100 | #277 | Tragic 17.7% |
| Germans | 0.0 /100 | #278 | Tragic 17.7% |
| Iroquois | 0.0 /100 | #279 | Tragic 17.7% |
| Scottish | 0.0 /100 | #280 | Tragic 17.7% |
| English | 0.0 /100 | #281 | Tragic 17.8% |
| Dutch | 0.0 /100 | #282 | Tragic 17.8% |
| Alsatians | 0.0 /100 | #283 | Tragic 17.8% |
| Welsh | 0.0 /100 | #284 | Tragic 17.8% |
| Immigrants | Lebanon | 0.0 /100 | #285 | Tragic 17.9% |
| Immigrants | North Macedonia | 0.0 /100 | #286 | Tragic 17.9% |
| Carpatho Rusyns | 0.0 /100 | #287 | Tragic 18.0% |
| Bahamians | 0.0 /100 | #288 | Tragic 18.0% |
| Irish | 0.0 /100 | #289 | Tragic 18.0% |
| West Indians | 0.0 /100 | #290 | Tragic 18.0% |
| Alaskan Athabascans | 0.0 /100 | #291 | Tragic 18.1% |
| Immigrants | Bahamas | 0.0 /100 | #292 | Tragic 18.1% |