Somali vs Mongolian Female Poverty Among 18-24 Year Olds
COMPARE
Somali
Mongolian
Female Poverty Among 18-24 Year Olds
Female Poverty Among 18-24 Year Olds Comparison
Somalis
Mongolians
25.1%
FEMALE POVERTY AMONG 18-24 YEAR OLDS
0.0/ 100
METRIC RATING
322nd/ 347
METRIC RANK
21.6%
FEMALE POVERTY AMONG 18-24 YEAR OLDS
0.2/ 100
METRIC RATING
270th/ 347
METRIC RANK
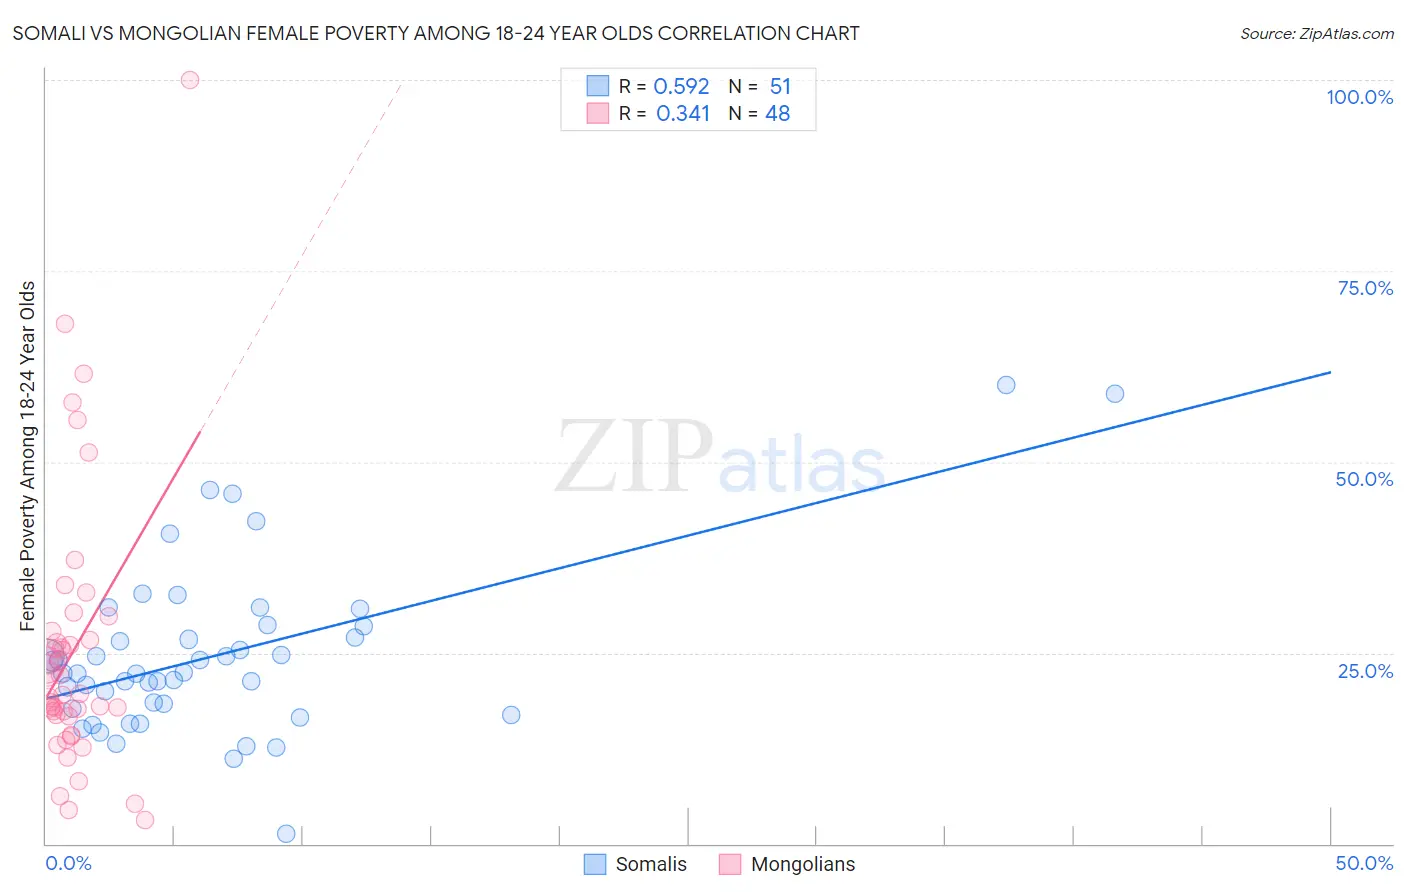
Somali vs Mongolian Female Poverty Among 18-24 Year Olds Correlation Chart
The statistical analysis conducted on geographies consisting of 98,981,198 people shows a substantial positive correlation between the proportion of Somalis and poverty level among females between the ages 18 and 24 in the United States with a correlation coefficient (R) of 0.592 and weighted average of 25.1%. Similarly, the statistical analysis conducted on geographies consisting of 139,425,379 people shows a mild positive correlation between the proportion of Mongolians and poverty level among females between the ages 18 and 24 in the United States with a correlation coefficient (R) of 0.341 and weighted average of 21.6%, a difference of 16.4%.
Female Poverty Among 18-24 Year Olds Correlation Summary
| Measurement | Somali | Mongolian |
| Minimum | 1.4% | 3.0% |
| Maximum | 60.0% | 100.0% |
| Range | 58.6% | 97.0% |
| Mean | 24.7% | 25.3% |
| Median | 22.3% | 19.6% |
| Interquartile 25% (IQ1) | 17.7% | 16.8% |
| Interquartile 75% (IQ3) | 28.4% | 27.2% |
| Interquartile Range (IQR) | 10.7% | 10.5% |
| Standard Deviation (Sample) | 11.1% | 18.1% |
| Standard Deviation (Population) | 11.0% | 17.9% |
Similar Demographics by Female Poverty Among 18-24 Year Olds
Demographics Similar to Somalis by Female Poverty Among 18-24 Year Olds
In terms of female poverty among 18-24 year olds, the demographic groups most similar to Somalis are Arapaho (25.2%, a difference of 0.070%), German Russian (25.2%, a difference of 0.10%), Immigrants from Zaire (25.1%, a difference of 0.30%), Immigrants from Saudi Arabia (25.3%, a difference of 0.53%), and Yakama (25.3%, a difference of 0.78%).
| Demographics | Rating | Rank | Female Poverty Among 18-24 Year Olds |
| Blacks/African Americans | 0.0 /100 | #315 | Tragic 24.3% |
| Alsatians | 0.0 /100 | #316 | Tragic 24.4% |
| Osage | 0.0 /100 | #317 | Tragic 24.5% |
| Chickasaw | 0.0 /100 | #318 | Tragic 24.5% |
| Dutch West Indians | 0.0 /100 | #319 | Tragic 24.5% |
| Immigrants | Congo | 0.0 /100 | #320 | Tragic 24.6% |
| Immigrants | Zaire | 0.0 /100 | #321 | Tragic 25.1% |
| Somalis | 0.0 /100 | #322 | Tragic 25.1% |
| Arapaho | 0.0 /100 | #323 | Tragic 25.2% |
| German Russians | 0.0 /100 | #324 | Tragic 25.2% |
| Immigrants | Saudi Arabia | 0.0 /100 | #325 | Tragic 25.3% |
| Yakama | 0.0 /100 | #326 | Tragic 25.3% |
| Ute | 0.0 /100 | #327 | Tragic 25.4% |
| Natives/Alaskans | 0.0 /100 | #328 | Tragic 25.4% |
| Cajuns | 0.0 /100 | #329 | Tragic 25.7% |
Demographics Similar to Mongolians by Female Poverty Among 18-24 Year Olds
In terms of female poverty among 18-24 year olds, the demographic groups most similar to Mongolians are Scotch-Irish (21.6%, a difference of 0.010%), Celtic (21.6%, a difference of 0.030%), Immigrants from Burma/Myanmar (21.6%, a difference of 0.090%), American (21.6%, a difference of 0.23%), and Basque (21.7%, a difference of 0.29%).
| Demographics | Rating | Rank | Female Poverty Among 18-24 Year Olds |
| Icelanders | 0.3 /100 | #263 | Tragic 21.5% |
| Hondurans | 0.3 /100 | #264 | Tragic 21.5% |
| Immigrants | Nonimmigrants | 0.3 /100 | #265 | Tragic 21.5% |
| Alaska Natives | 0.3 /100 | #266 | Tragic 21.5% |
| Americans | 0.3 /100 | #267 | Tragic 21.6% |
| Immigrants | Burma/Myanmar | 0.2 /100 | #268 | Tragic 21.6% |
| Celtics | 0.2 /100 | #269 | Tragic 21.6% |
| Mongolians | 0.2 /100 | #270 | Tragic 21.6% |
| Scotch-Irish | 0.2 /100 | #271 | Tragic 21.6% |
| Basques | 0.2 /100 | #272 | Tragic 21.7% |
| New Zealanders | 0.2 /100 | #273 | Tragic 21.7% |
| Immigrants | Honduras | 0.1 /100 | #274 | Tragic 21.8% |
| Immigrants | Bangladesh | 0.1 /100 | #275 | Tragic 21.8% |
| Bahamians | 0.1 /100 | #276 | Tragic 21.8% |
| Immigrants | Switzerland | 0.1 /100 | #277 | Tragic 21.8% |