Cambodian vs Immigrants from Ukraine Family Poverty
COMPARE
Cambodian
Immigrants from Ukraine
Family Poverty
Family Poverty Comparison
Cambodians
Immigrants from Ukraine
7.8%
FAMILY POVERTY
98.2/ 100
METRIC RATING
71st/ 347
METRIC RANK
8.5%
FAMILY POVERTY
83.9/ 100
METRIC RATING
141st/ 347
METRIC RANK
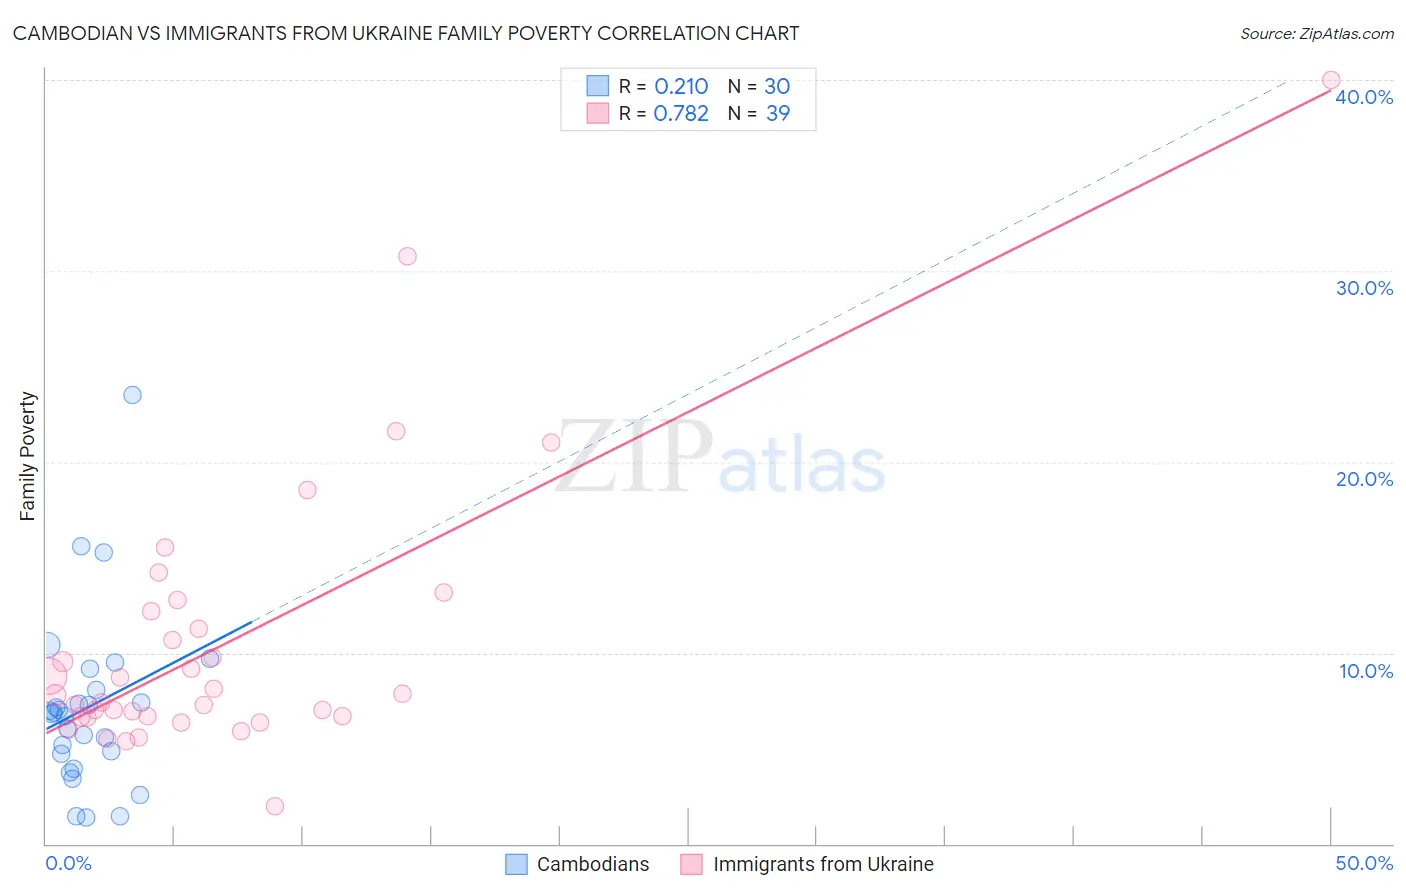
Cambodian vs Immigrants from Ukraine Family Poverty Correlation Chart
The statistical analysis conducted on geographies consisting of 102,420,102 people shows a weak positive correlation between the proportion of Cambodians and poverty level among families in the United States with a correlation coefficient (R) of 0.210 and weighted average of 7.8%. Similarly, the statistical analysis conducted on geographies consisting of 289,107,517 people shows a strong positive correlation between the proportion of Immigrants from Ukraine and poverty level among families in the United States with a correlation coefficient (R) of 0.782 and weighted average of 8.5%, a difference of 8.9%.
Family Poverty Correlation Summary
| Measurement | Cambodian | Immigrants from Ukraine |
| Minimum | 1.4% | 2.0% |
| Maximum | 23.5% | 40.0% |
| Range | 22.1% | 38.0% |
| Mean | 7.2% | 10.5% |
| Median | 6.8% | 7.8% |
| Interquartile 25% (IQ1) | 4.7% | 6.6% |
| Interquartile 75% (IQ3) | 8.0% | 12.2% |
| Interquartile Range (IQR) | 3.3% | 5.5% |
| Standard Deviation (Sample) | 4.6% | 7.3% |
| Standard Deviation (Population) | 4.5% | 7.2% |
Similar Demographics by Family Poverty
Demographics Similar to Cambodians by Family Poverty
In terms of family poverty, the demographic groups most similar to Cambodians are Immigrants from Canada (7.8%, a difference of 0.020%), Immigrants from Belgium (7.8%, a difference of 0.060%), Immigrants from Romania (7.8%, a difference of 0.060%), Austrian (7.8%, a difference of 0.060%), and Australian (7.8%, a difference of 0.070%).
| Demographics | Rating | Rank | Family Poverty |
| Koreans | 98.3 /100 | #64 | Exceptional 7.8% |
| Immigrants | Bulgaria | 98.3 /100 | #65 | Exceptional 7.8% |
| Dutch | 98.3 /100 | #66 | Exceptional 7.8% |
| Northern Europeans | 98.3 /100 | #67 | Exceptional 7.8% |
| Australians | 98.2 /100 | #68 | Exceptional 7.8% |
| Immigrants | Belgium | 98.2 /100 | #69 | Exceptional 7.8% |
| Immigrants | Canada | 98.2 /100 | #70 | Exceptional 7.8% |
| Cambodians | 98.2 /100 | #71 | Exceptional 7.8% |
| Immigrants | Romania | 98.2 /100 | #72 | Exceptional 7.8% |
| Austrians | 98.2 /100 | #73 | Exceptional 7.8% |
| Immigrants | China | 98.1 /100 | #74 | Exceptional 7.8% |
| Immigrants | Croatia | 98.1 /100 | #75 | Exceptional 7.8% |
| Immigrants | Latvia | 98.0 /100 | #76 | Exceptional 7.9% |
| Ukrainians | 98.0 /100 | #77 | Exceptional 7.9% |
| Immigrants | North America | 97.9 /100 | #78 | Exceptional 7.9% |
Demographics Similar to Immigrants from Ukraine by Family Poverty
In terms of family poverty, the demographic groups most similar to Immigrants from Ukraine are Immigrants from Kazakhstan (8.5%, a difference of 0.030%), Immigrants from Nepal (8.5%, a difference of 0.060%), Yugoslavian (8.5%, a difference of 0.11%), Immigrants from Germany (8.5%, a difference of 0.15%), and Albanian (8.5%, a difference of 0.16%).
| Demographics | Rating | Rank | Family Poverty |
| Chileans | 86.6 /100 | #134 | Excellent 8.5% |
| Immigrants | Malaysia | 86.5 /100 | #135 | Excellent 8.5% |
| Immigrants | Brazil | 86.3 /100 | #136 | Excellent 8.5% |
| Immigrants | Southern Europe | 86.0 /100 | #137 | Excellent 8.5% |
| Armenians | 84.6 /100 | #138 | Excellent 8.5% |
| Immigrants | Nepal | 84.2 /100 | #139 | Excellent 8.5% |
| Immigrants | Kazakhstan | 84.1 /100 | #140 | Excellent 8.5% |
| Immigrants | Ukraine | 83.9 /100 | #141 | Excellent 8.5% |
| Yugoslavians | 83.5 /100 | #142 | Excellent 8.5% |
| Immigrants | Germany | 83.3 /100 | #143 | Excellent 8.5% |
| Albanians | 83.3 /100 | #144 | Excellent 8.5% |
| Immigrants | South Eastern Asia | 83.2 /100 | #145 | Excellent 8.5% |
| Immigrants | Belarus | 83.2 /100 | #146 | Excellent 8.5% |
| Immigrants | Jordan | 83.0 /100 | #147 | Excellent 8.5% |
| Scotch-Irish | 82.2 /100 | #148 | Excellent 8.6% |