Hawaiian vs Immigrants from Bangladesh In Labor Force | Age 30-34
COMPARE
Hawaiian
Immigrants from Bangladesh
In Labor Force | Age 30-34
In Labor Force | Age 30-34 Comparison
Hawaiians
Immigrants from Bangladesh
83.0%
IN LABOR FORCE | AGE 30-34
0.0/ 100
METRIC RATING
289th/ 347
METRIC RANK
83.6%
IN LABOR FORCE | AGE 30-34
0.1/ 100
METRIC RATING
268th/ 347
METRIC RANK
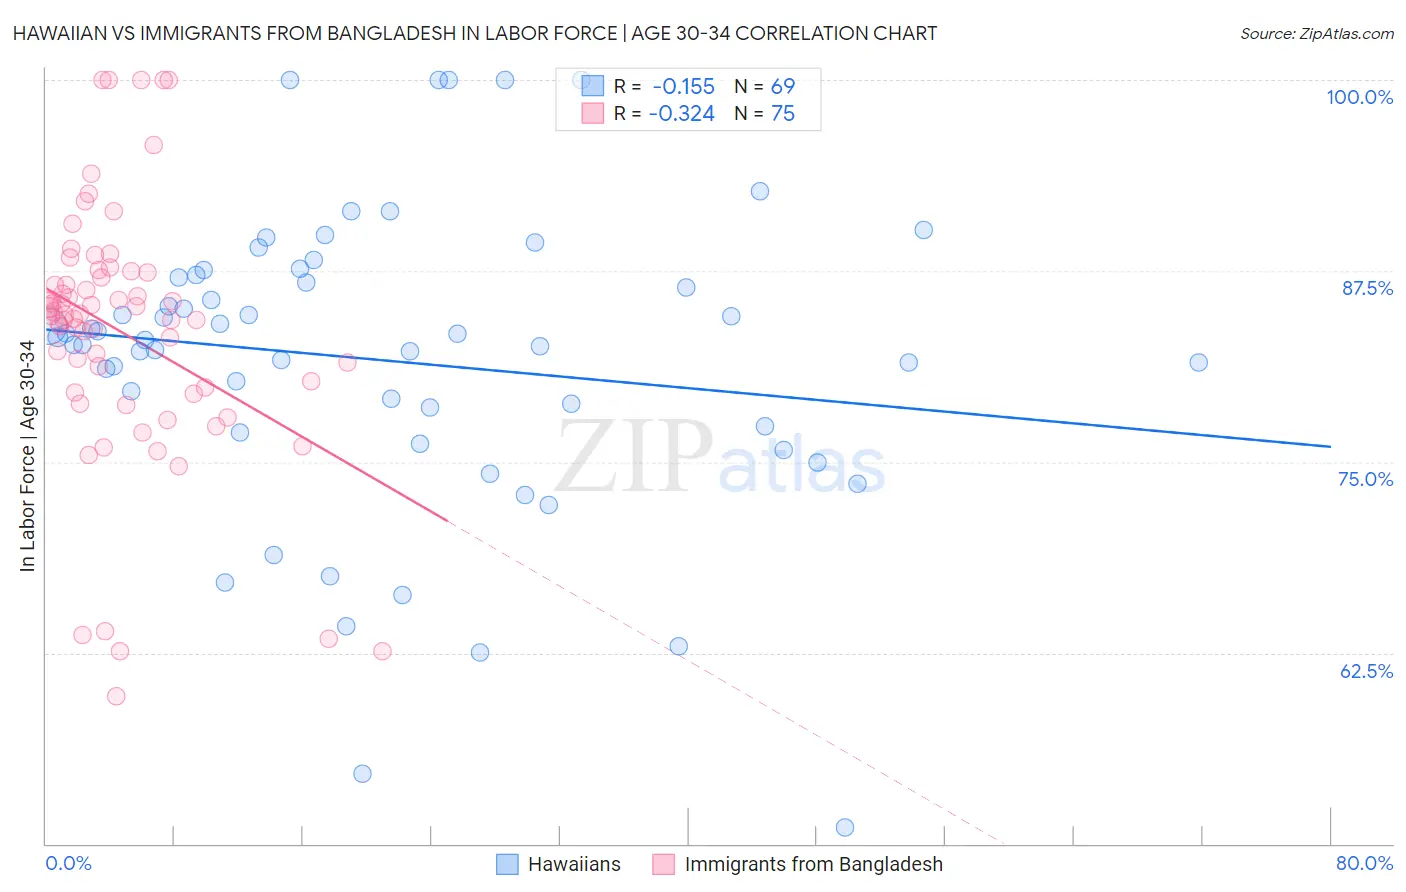
Hawaiian vs Immigrants from Bangladesh In Labor Force | Age 30-34 Correlation Chart
The statistical analysis conducted on geographies consisting of 327,455,598 people shows a poor negative correlation between the proportion of Hawaiians and labor force participation rate among population between the ages 30 and 34 in the United States with a correlation coefficient (R) of -0.155 and weighted average of 83.0%. Similarly, the statistical analysis conducted on geographies consisting of 203,612,100 people shows a mild negative correlation between the proportion of Immigrants from Bangladesh and labor force participation rate among population between the ages 30 and 34 in the United States with a correlation coefficient (R) of -0.324 and weighted average of 83.6%, a difference of 0.72%.
In Labor Force | Age 30-34 Correlation Summary
| Measurement | Hawaiian | Immigrants from Bangladesh |
| Minimum | 51.1% | 59.7% |
| Maximum | 100.0% | 100.0% |
| Range | 48.9% | 40.3% |
| Mean | 81.7% | 83.5% |
| Median | 83.0% | 84.6% |
| Interquartile 25% (IQ1) | 77.2% | 79.6% |
| Interquartile 75% (IQ3) | 87.1% | 87.4% |
| Interquartile Range (IQR) | 10.0% | 7.8% |
| Standard Deviation (Sample) | 9.9% | 8.5% |
| Standard Deviation (Population) | 9.8% | 8.4% |
Similar Demographics by In Labor Force | Age 30-34
Demographics Similar to Hawaiians by In Labor Force | Age 30-34
In terms of in labor force | age 30-34, the demographic groups most similar to Hawaiians are Central American Indian (83.0%, a difference of 0.020%), Native Hawaiian (83.0%, a difference of 0.050%), Immigrants from Latin America (83.1%, a difference of 0.15%), Immigrants from Belize (83.2%, a difference of 0.21%), and Cree (83.2%, a difference of 0.21%).
| Demographics | Rating | Rank | In Labor Force | Age 30-34 |
| Mexican American Indians | 0.0 /100 | #282 | Tragic 83.2% |
| Assyrians/Chaldeans/Syriacs | 0.0 /100 | #283 | Tragic 83.2% |
| Immigrants | Belize | 0.0 /100 | #284 | Tragic 83.2% |
| Cree | 0.0 /100 | #285 | Tragic 83.2% |
| Immigrants | Latin America | 0.0 /100 | #286 | Tragic 83.1% |
| Native Hawaiians | 0.0 /100 | #287 | Tragic 83.0% |
| Central American Indians | 0.0 /100 | #288 | Tragic 83.0% |
| Hawaiians | 0.0 /100 | #289 | Tragic 83.0% |
| Blackfeet | 0.0 /100 | #290 | Tragic 82.8% |
| Potawatomi | 0.0 /100 | #291 | Tragic 82.8% |
| Blacks/African Americans | 0.0 /100 | #292 | Tragic 82.8% |
| Nepalese | 0.0 /100 | #293 | Tragic 82.7% |
| Americans | 0.0 /100 | #294 | Tragic 82.7% |
| Pennsylvania Germans | 0.0 /100 | #295 | Tragic 82.6% |
| Chippewa | 0.0 /100 | #296 | Tragic 82.6% |
Demographics Similar to Immigrants from Bangladesh by In Labor Force | Age 30-34
In terms of in labor force | age 30-34, the demographic groups most similar to Immigrants from Bangladesh are Spaniard (83.6%, a difference of 0.010%), Vietnamese (83.6%, a difference of 0.010%), Spanish American (83.5%, a difference of 0.060%), Spanish (83.5%, a difference of 0.080%), and Nonimmigrants (83.5%, a difference of 0.080%).
| Demographics | Rating | Rank | In Labor Force | Age 30-34 |
| Guyanese | 0.3 /100 | #261 | Tragic 83.8% |
| Dominicans | 0.2 /100 | #262 | Tragic 83.8% |
| Immigrants | Guyana | 0.2 /100 | #263 | Tragic 83.8% |
| Guatemalans | 0.2 /100 | #264 | Tragic 83.7% |
| Immigrants | Honduras | 0.1 /100 | #265 | Tragic 83.7% |
| Immigrants | Guatemala | 0.1 /100 | #266 | Tragic 83.7% |
| Spaniards | 0.1 /100 | #267 | Tragic 83.6% |
| Immigrants | Bangladesh | 0.1 /100 | #268 | Tragic 83.6% |
| Vietnamese | 0.1 /100 | #269 | Tragic 83.6% |
| Spanish Americans | 0.0 /100 | #270 | Tragic 83.5% |
| Spanish | 0.0 /100 | #271 | Tragic 83.5% |
| Immigrants | Nonimmigrants | 0.0 /100 | #272 | Tragic 83.5% |
| Guamanians/Chamorros | 0.0 /100 | #273 | Tragic 83.5% |
| Belizeans | 0.0 /100 | #274 | Tragic 83.5% |
| Immigrants | Grenada | 0.0 /100 | #275 | Tragic 83.5% |