Asian vs Immigrants from Bangladesh Male Poverty
COMPARE
Asian
Immigrants from Bangladesh
Male Poverty
Male Poverty Comparison
Asians
Immigrants from Bangladesh
10.0%
MALE POVERTY
98.7/ 100
METRIC RATING
52nd/ 347
METRIC RANK
14.1%
MALE POVERTY
0.0/ 100
METRIC RATING
305th/ 347
METRIC RANK
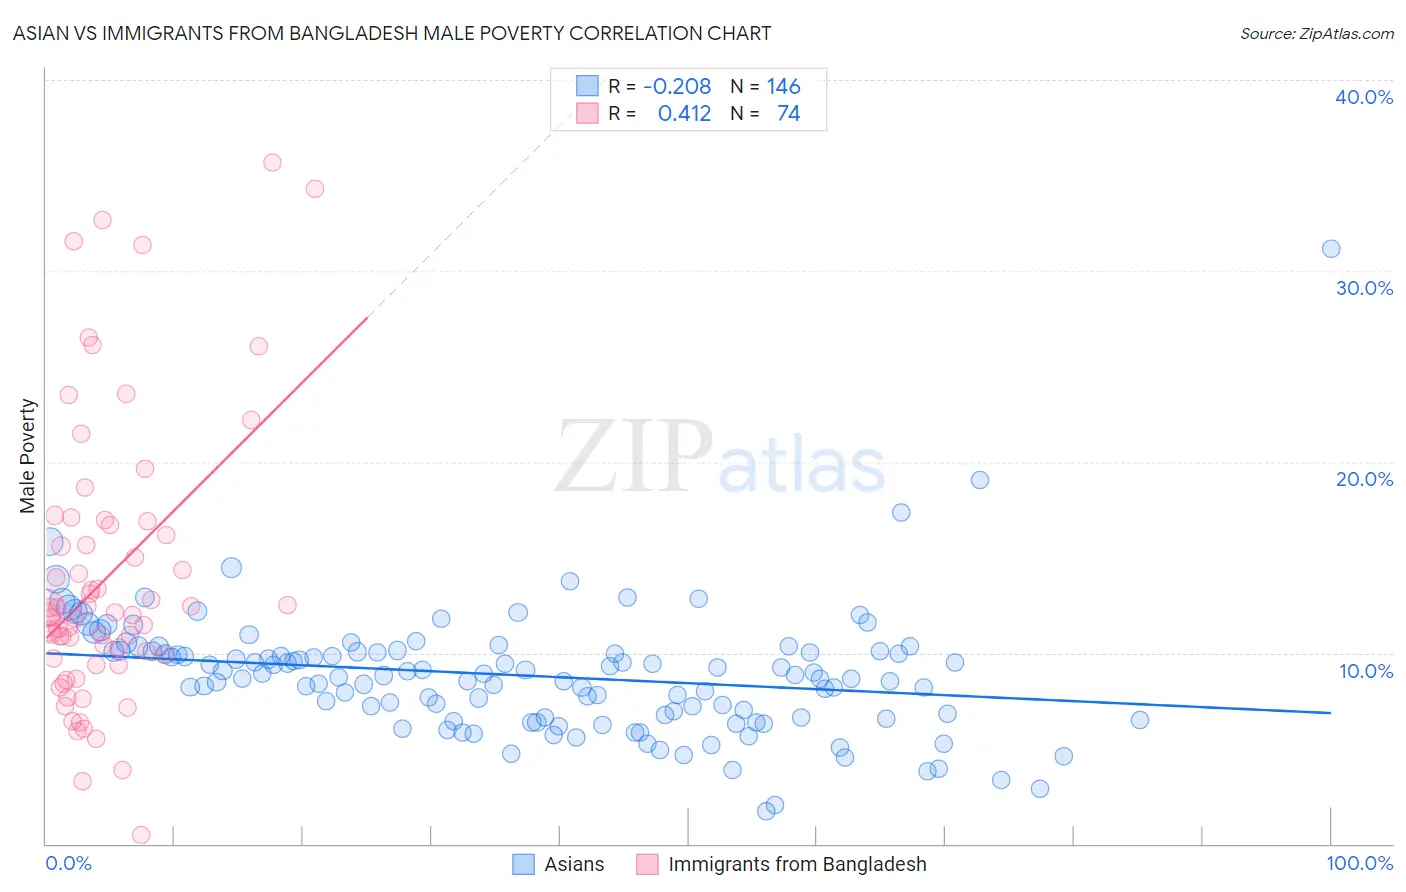
Asian vs Immigrants from Bangladesh Male Poverty Correlation Chart
The statistical analysis conducted on geographies consisting of 549,643,011 people shows a weak negative correlation between the proportion of Asians and poverty level among males in the United States with a correlation coefficient (R) of -0.208 and weighted average of 10.0%. Similarly, the statistical analysis conducted on geographies consisting of 203,544,271 people shows a moderate positive correlation between the proportion of Immigrants from Bangladesh and poverty level among males in the United States with a correlation coefficient (R) of 0.412 and weighted average of 14.1%, a difference of 40.8%.
Male Poverty Correlation Summary
| Measurement | Asian | Immigrants from Bangladesh |
| Minimum | 1.7% | 0.44% |
| Maximum | 31.2% | 35.7% |
| Range | 29.4% | 35.2% |
| Mean | 8.8% | 13.9% |
| Median | 8.8% | 12.1% |
| Interquartile 25% (IQ1) | 6.6% | 9.7% |
| Interquartile 75% (IQ3) | 10.1% | 16.7% |
| Interquartile Range (IQR) | 3.5% | 7.0% |
| Standard Deviation (Sample) | 3.3% | 7.4% |
| Standard Deviation (Population) | 3.3% | 7.3% |
Similar Demographics by Male Poverty
Demographics Similar to Asians by Male Poverty
In terms of male poverty, the demographic groups most similar to Asians are Immigrants from Czechoslovakia (10.0%, a difference of 0.070%), Immigrants from Croatia (10.0%, a difference of 0.090%), Immigrants from Philippines (10.0%, a difference of 0.19%), Slovene (10.0%, a difference of 0.24%), and Immigrants from Singapore (10.0%, a difference of 0.34%).
| Demographics | Rating | Rank | Male Poverty |
| Immigrants | Serbia | 98.9 /100 | #45 | Exceptional 10.0% |
| Turks | 98.9 /100 | #46 | Exceptional 10.0% |
| Immigrants | Singapore | 98.8 /100 | #47 | Exceptional 10.0% |
| Immigrants | Japan | 98.8 /100 | #48 | Exceptional 10.0% |
| Slovenes | 98.8 /100 | #49 | Exceptional 10.0% |
| Immigrants | Philippines | 98.7 /100 | #50 | Exceptional 10.0% |
| Immigrants | Croatia | 98.7 /100 | #51 | Exceptional 10.0% |
| Asians | 98.7 /100 | #52 | Exceptional 10.0% |
| Immigrants | Czechoslovakia | 98.6 /100 | #53 | Exceptional 10.0% |
| Immigrants | Austria | 98.5 /100 | #54 | Exceptional 10.0% |
| Germans | 98.3 /100 | #55 | Exceptional 10.1% |
| Immigrants | Bulgaria | 98.2 /100 | #56 | Exceptional 10.1% |
| Estonians | 98.1 /100 | #57 | Exceptional 10.1% |
| Scandinavians | 98.0 /100 | #58 | Exceptional 10.1% |
| Immigrants | Europe | 97.9 /100 | #59 | Exceptional 10.1% |
Demographics Similar to Immigrants from Bangladesh by Male Poverty
In terms of male poverty, the demographic groups most similar to Immigrants from Bangladesh are Creek (14.1%, a difference of 0.070%), Senegalese (14.1%, a difference of 0.21%), Bahamian (14.1%, a difference of 0.32%), Immigrants from Caribbean (14.0%, a difference of 0.36%), and Immigrants from Senegal (14.0%, a difference of 0.42%).
| Demographics | Rating | Rank | Male Poverty |
| Blackfeet | 0.0 /100 | #298 | Tragic 14.0% |
| Immigrants | Guatemala | 0.0 /100 | #299 | Tragic 14.0% |
| Immigrants | Mexico | 0.0 /100 | #300 | Tragic 14.0% |
| Immigrants | Senegal | 0.0 /100 | #301 | Tragic 14.0% |
| Immigrants | Caribbean | 0.0 /100 | #302 | Tragic 14.0% |
| Bahamians | 0.0 /100 | #303 | Tragic 14.1% |
| Senegalese | 0.0 /100 | #304 | Tragic 14.1% |
| Immigrants | Bangladesh | 0.0 /100 | #305 | Tragic 14.1% |
| Creek | 0.0 /100 | #306 | Tragic 14.1% |
| Dutch West Indians | 0.0 /100 | #307 | Tragic 14.2% |
| Africans | 0.0 /100 | #308 | Tragic 14.2% |
| Somalis | 0.0 /100 | #309 | Tragic 14.3% |
| Seminole | 0.0 /100 | #310 | Tragic 14.3% |
| Hondurans | 0.0 /100 | #311 | Tragic 14.3% |
| Choctaw | 0.0 /100 | #312 | Tragic 14.4% |