Hawaiian vs Immigrants from Bangladesh Receiving Food Stamps
COMPARE
Hawaiian
Immigrants from Bangladesh
Receiving Food Stamps
Receiving Food Stamps Comparison
Hawaiians
Immigrants from Bangladesh
12.9%
RECEIVING FOOD STAMPS
5.4/ 100
METRIC RATING
218th/ 347
METRIC RANK
15.9%
RECEIVING FOOD STAMPS
0.0/ 100
METRIC RATING
300th/ 347
METRIC RANK
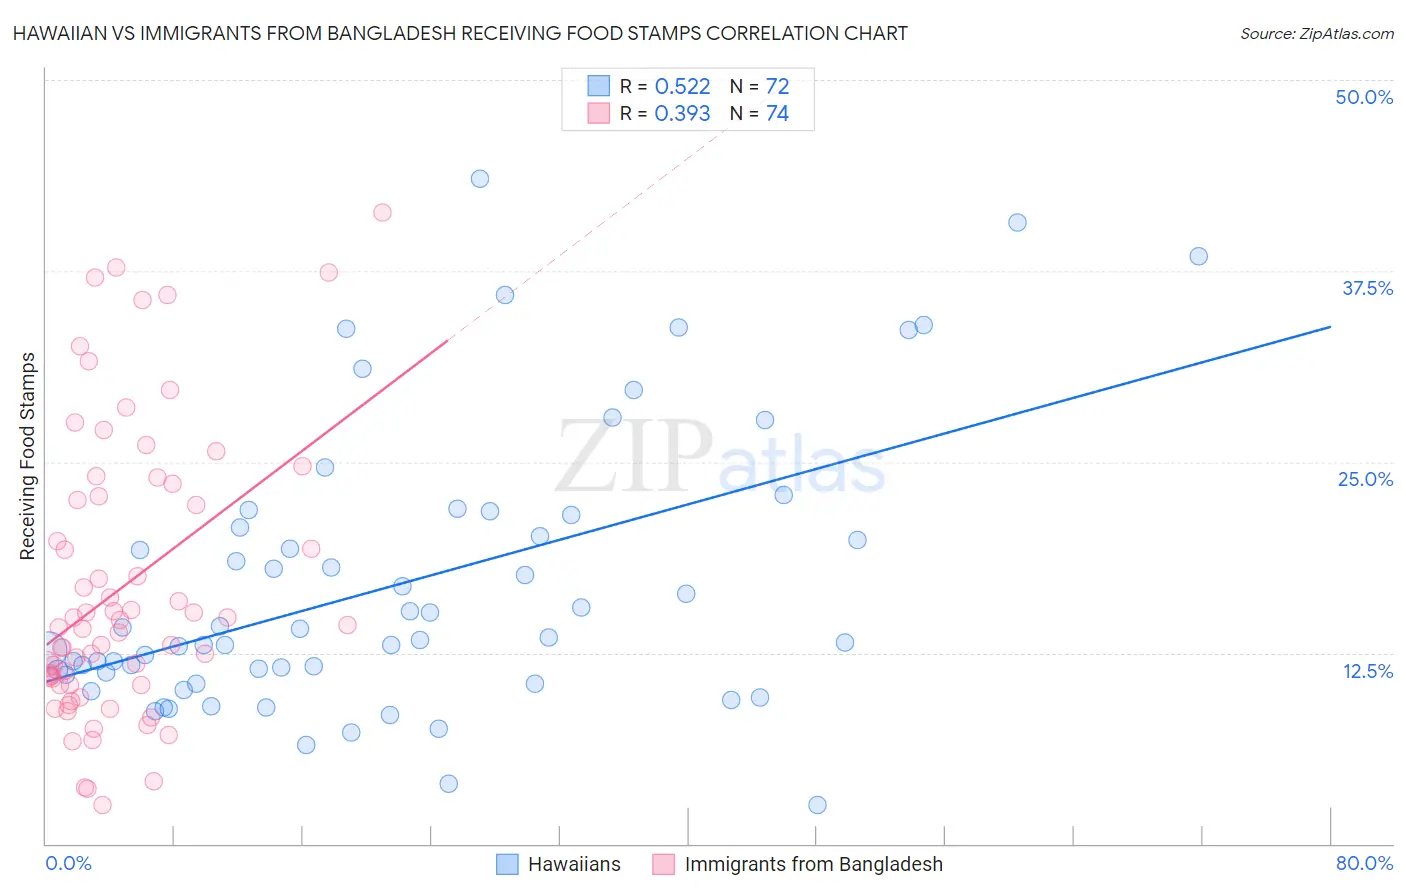
Hawaiian vs Immigrants from Bangladesh Receiving Food Stamps Correlation Chart
The statistical analysis conducted on geographies consisting of 327,058,596 people shows a substantial positive correlation between the proportion of Hawaiians and percentage of population receiving government assistance and/or food stamps in the United States with a correlation coefficient (R) of 0.522 and weighted average of 12.9%. Similarly, the statistical analysis conducted on geographies consisting of 203,302,567 people shows a mild positive correlation between the proportion of Immigrants from Bangladesh and percentage of population receiving government assistance and/or food stamps in the United States with a correlation coefficient (R) of 0.393 and weighted average of 15.9%, a difference of 23.1%.
Receiving Food Stamps Correlation Summary
| Measurement | Hawaiian | Immigrants from Bangladesh |
| Minimum | 2.5% | 2.5% |
| Maximum | 43.5% | 41.3% |
| Range | 41.0% | 38.8% |
| Mean | 17.0% | 16.8% |
| Median | 13.4% | 14.2% |
| Interquartile 25% (IQ1) | 11.1% | 10.4% |
| Interquartile 75% (IQ3) | 21.1% | 22.7% |
| Interquartile Range (IQR) | 10.0% | 12.3% |
| Standard Deviation (Sample) | 9.1% | 9.2% |
| Standard Deviation (Population) | 9.1% | 9.2% |
Similar Demographics by Receiving Food Stamps
Demographics Similar to Hawaiians by Receiving Food Stamps
In terms of receiving food stamps, the demographic groups most similar to Hawaiians are Immigrants from Middle Africa (12.9%, a difference of 0.010%), Immigrants from Colombia (12.9%, a difference of 0.050%), Immigrants from Burma/Myanmar (12.9%, a difference of 0.37%), Bermudan (13.0%, a difference of 0.37%), and Immigrants from South America (12.8%, a difference of 0.63%).
| Demographics | Rating | Rank | Receiving Food Stamps |
| Colombians | 10.2 /100 | #211 | Poor 12.6% |
| Malaysians | 8.5 /100 | #212 | Tragic 12.7% |
| Moroccans | 7.6 /100 | #213 | Tragic 12.8% |
| Immigrants | Africa | 7.6 /100 | #214 | Tragic 12.8% |
| Native Hawaiians | 6.7 /100 | #215 | Tragic 12.8% |
| Immigrants | South America | 6.5 /100 | #216 | Tragic 12.8% |
| Immigrants | Burma/Myanmar | 6.0 /100 | #217 | Tragic 12.9% |
| Hawaiians | 5.4 /100 | #218 | Tragic 12.9% |
| Immigrants | Middle Africa | 5.4 /100 | #219 | Tragic 12.9% |
| Immigrants | Colombia | 5.3 /100 | #220 | Tragic 12.9% |
| Bermudans | 4.8 /100 | #221 | Tragic 13.0% |
| Immigrants | Immigrants | 4.4 /100 | #222 | Tragic 13.0% |
| Immigrants | Albania | 4.4 /100 | #223 | Tragic 13.0% |
| Immigrants | Armenia | 4.3 /100 | #224 | Tragic 13.0% |
| Fijians | 4.3 /100 | #225 | Tragic 13.0% |
Demographics Similar to Immigrants from Bangladesh by Receiving Food Stamps
In terms of receiving food stamps, the demographic groups most similar to Immigrants from Bangladesh are Hispanic or Latino (15.8%, a difference of 0.43%), Trinidadian and Tobagonian (16.0%, a difference of 0.45%), Immigrants from Trinidad and Tobago (15.8%, a difference of 0.71%), Immigrants from Bahamas (15.8%, a difference of 0.96%), and Tsimshian (15.7%, a difference of 1.1%).
| Demographics | Rating | Rank | Receiving Food Stamps |
| Vietnamese | 0.0 /100 | #293 | Tragic 15.7% |
| Immigrants | Latin America | 0.0 /100 | #294 | Tragic 15.7% |
| Immigrants | Honduras | 0.0 /100 | #295 | Tragic 15.7% |
| Tsimshian | 0.0 /100 | #296 | Tragic 15.7% |
| Immigrants | Bahamas | 0.0 /100 | #297 | Tragic 15.8% |
| Immigrants | Trinidad and Tobago | 0.0 /100 | #298 | Tragic 15.8% |
| Hispanics or Latinos | 0.0 /100 | #299 | Tragic 15.8% |
| Immigrants | Bangladesh | 0.0 /100 | #300 | Tragic 15.9% |
| Trinidadians and Tobagonians | 0.0 /100 | #301 | Tragic 16.0% |
| Immigrants | West Indies | 0.0 /100 | #302 | Tragic 16.1% |
| Nicaraguans | 0.0 /100 | #303 | Tragic 16.1% |
| West Indians | 0.0 /100 | #304 | Tragic 16.3% |
| Immigrants | Azores | 0.0 /100 | #305 | Tragic 16.4% |
| Jamaicans | 0.0 /100 | #306 | Tragic 16.4% |
| Houma | 0.0 /100 | #307 | Tragic 16.5% |