Haitian vs Laotian Family Poverty
COMPARE
Haitian
Laotian
Family Poverty
Family Poverty Comparison
Haitians
Laotians
11.5%
FAMILY POVERTY
0.0/ 100
METRIC RATING
291st/ 347
METRIC RANK
8.1%
FAMILY POVERTY
95.6/ 100
METRIC RATING
105th/ 347
METRIC RANK
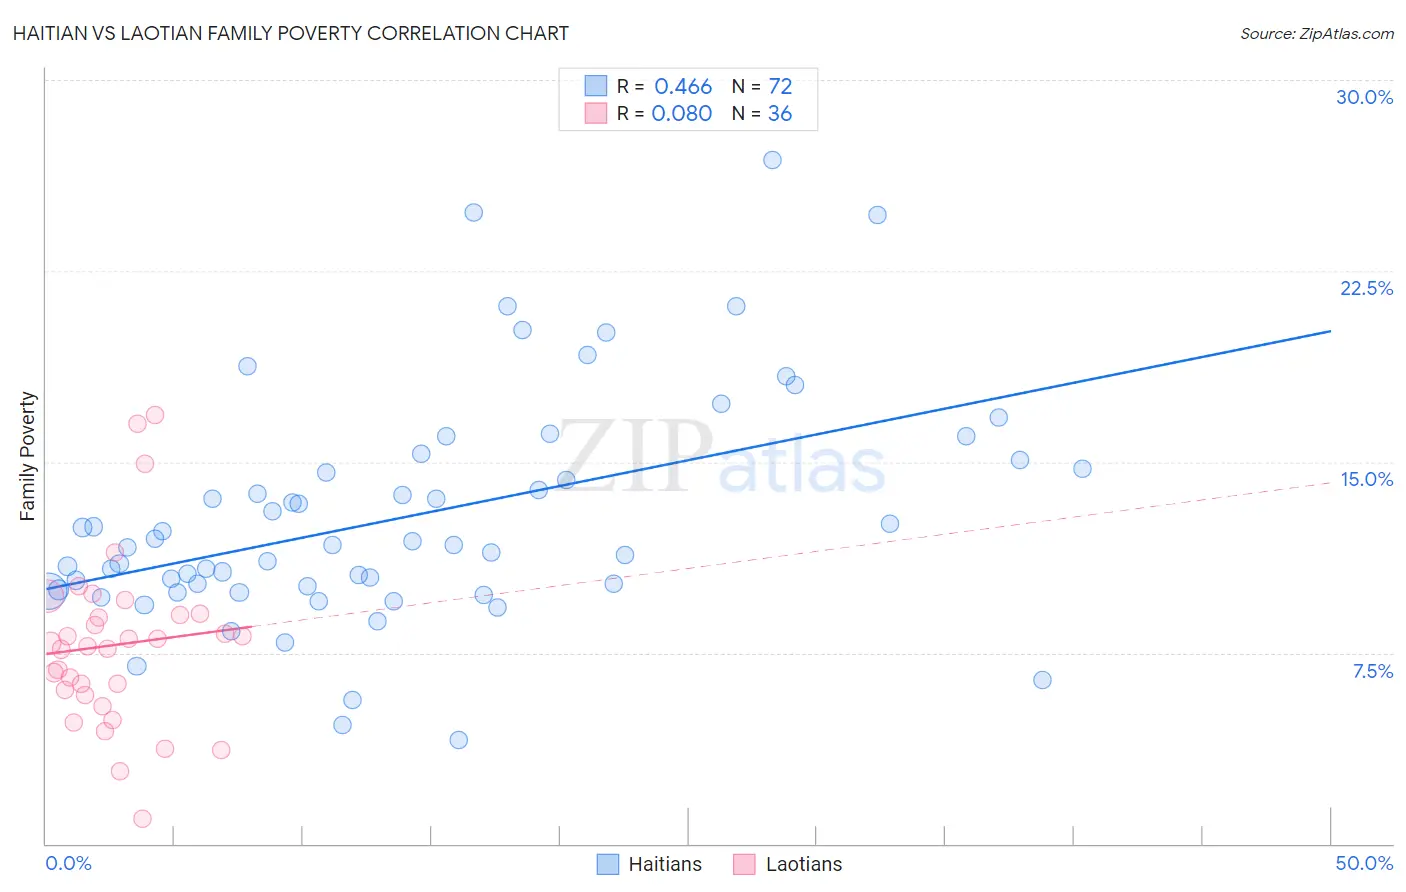
Haitian vs Laotian Family Poverty Correlation Chart
The statistical analysis conducted on geographies consisting of 287,320,460 people shows a moderate positive correlation between the proportion of Haitians and poverty level among families in the United States with a correlation coefficient (R) of 0.466 and weighted average of 11.5%. Similarly, the statistical analysis conducted on geographies consisting of 224,550,821 people shows a slight positive correlation between the proportion of Laotians and poverty level among families in the United States with a correlation coefficient (R) of 0.080 and weighted average of 8.1%, a difference of 42.4%.
Family Poverty Correlation Summary
| Measurement | Haitian | Laotian |
| Minimum | 4.1% | 0.98% |
| Maximum | 26.8% | 16.8% |
| Range | 22.8% | 15.9% |
| Mean | 12.9% | 7.8% |
| Median | 11.7% | 7.8% |
| Interquartile 25% (IQ1) | 10.0% | 6.0% |
| Interquartile 75% (IQ3) | 14.9% | 9.0% |
| Interquartile Range (IQR) | 4.9% | 3.1% |
| Standard Deviation (Sample) | 4.5% | 3.4% |
| Standard Deviation (Population) | 4.5% | 3.3% |
Similar Demographics by Family Poverty
Demographics Similar to Haitians by Family Poverty
In terms of family poverty, the demographic groups most similar to Haitians are West Indian (11.5%, a difference of 0.060%), Immigrants from Barbados (11.5%, a difference of 0.070%), Immigrants from Somalia (11.5%, a difference of 0.11%), Immigrants from Belize (11.5%, a difference of 0.12%), and Vietnamese (11.5%, a difference of 0.31%).
| Demographics | Rating | Rank | Family Poverty |
| Yaqui | 0.0 /100 | #284 | Tragic 11.3% |
| Barbadians | 0.0 /100 | #285 | Tragic 11.3% |
| Senegalese | 0.0 /100 | #286 | Tragic 11.5% |
| Vietnamese | 0.0 /100 | #287 | Tragic 11.5% |
| Immigrants | Belize | 0.0 /100 | #288 | Tragic 11.5% |
| Immigrants | Barbados | 0.0 /100 | #289 | Tragic 11.5% |
| West Indians | 0.0 /100 | #290 | Tragic 11.5% |
| Haitians | 0.0 /100 | #291 | Tragic 11.5% |
| Immigrants | Somalia | 0.0 /100 | #292 | Tragic 11.5% |
| Immigrants | Cabo Verde | 0.0 /100 | #293 | Tragic 11.6% |
| Immigrants | St. Vincent and the Grenadines | 0.0 /100 | #294 | Tragic 11.6% |
| Immigrants | Haiti | 0.0 /100 | #295 | Tragic 11.6% |
| Choctaw | 0.0 /100 | #296 | Tragic 11.6% |
| Creek | 0.0 /100 | #297 | Tragic 11.7% |
| Immigrants | Senegal | 0.0 /100 | #298 | Tragic 11.7% |
Demographics Similar to Laotians by Family Poverty
In terms of family poverty, the demographic groups most similar to Laotians are Slavic (8.1%, a difference of 0.030%), Immigrants from Eastern Europe (8.1%, a difference of 0.040%), Immigrants from Indonesia (8.1%, a difference of 0.13%), Immigrants from Norway (8.1%, a difference of 0.14%), and New Zealander (8.1%, a difference of 0.17%).
| Demographics | Rating | Rank | Family Poverty |
| Immigrants | South Africa | 95.9 /100 | #98 | Exceptional 8.1% |
| Welsh | 95.8 /100 | #99 | Exceptional 8.1% |
| New Zealanders | 95.8 /100 | #100 | Exceptional 8.1% |
| Immigrants | Norway | 95.7 /100 | #101 | Exceptional 8.1% |
| Immigrants | Indonesia | 95.7 /100 | #102 | Exceptional 8.1% |
| Immigrants | Eastern Europe | 95.6 /100 | #103 | Exceptional 8.1% |
| Slavs | 95.6 /100 | #104 | Exceptional 8.1% |
| Laotians | 95.6 /100 | #105 | Exceptional 8.1% |
| Egyptians | 95.1 /100 | #106 | Exceptional 8.1% |
| French Canadians | 95.0 /100 | #107 | Exceptional 8.1% |
| Basques | 94.9 /100 | #108 | Exceptional 8.1% |
| Jordanians | 94.8 /100 | #109 | Exceptional 8.2% |
| Romanians | 94.7 /100 | #110 | Exceptional 8.2% |
| Taiwanese | 94.6 /100 | #111 | Exceptional 8.2% |
| Immigrants | France | 94.4 /100 | #112 | Exceptional 8.2% |