Immigrants from Uzbekistan vs Immigrants from Thailand Female Poverty Among 25-34 Year Olds
COMPARE
Immigrants from Uzbekistan
Immigrants from Thailand
Female Poverty Among 25-34 Year Olds
Female Poverty Among 25-34 Year Olds Comparison
Immigrants from Uzbekistan
Immigrants from Thailand
12.9%
FEMALE POVERTY AMONG 25-34 YEAR OLDS
89.6/ 100
METRIC RATING
130th/ 347
METRIC RANK
14.3%
FEMALE POVERTY AMONG 25-34 YEAR OLDS
5.2/ 100
METRIC RATING
218th/ 347
METRIC RANK
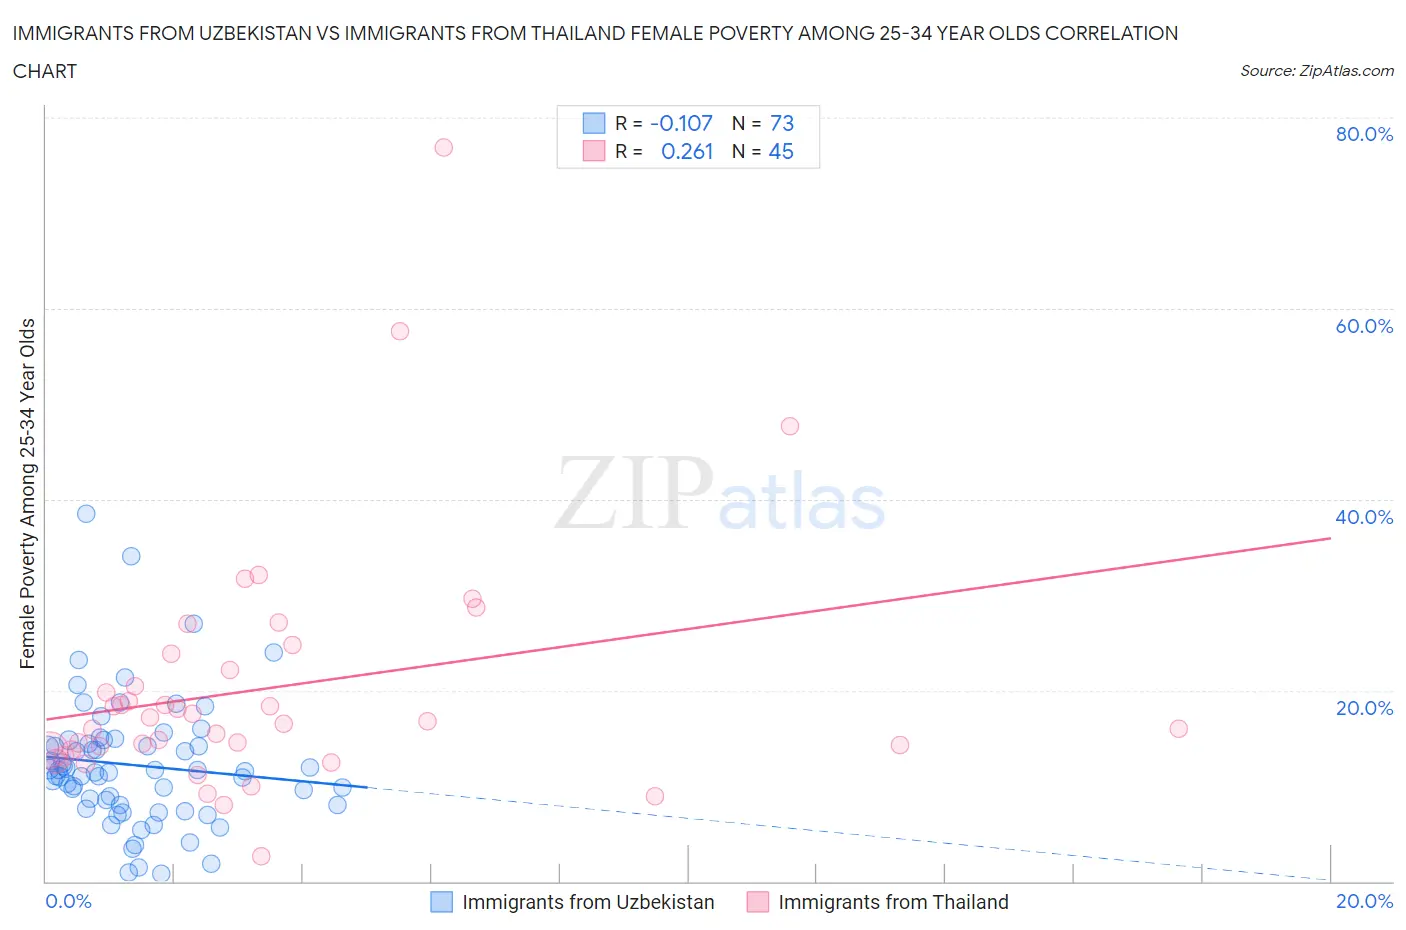
Immigrants from Uzbekistan vs Immigrants from Thailand Female Poverty Among 25-34 Year Olds Correlation Chart
The statistical analysis conducted on geographies consisting of 118,064,863 people shows a poor negative correlation between the proportion of Immigrants from Uzbekistan and poverty level among females between the ages 25 and 34 in the United States with a correlation coefficient (R) of -0.107 and weighted average of 12.9%. Similarly, the statistical analysis conducted on geographies consisting of 313,866,299 people shows a weak positive correlation between the proportion of Immigrants from Thailand and poverty level among females between the ages 25 and 34 in the United States with a correlation coefficient (R) of 0.261 and weighted average of 14.3%, a difference of 11.0%.
Female Poverty Among 25-34 Year Olds Correlation Summary
| Measurement | Immigrants from Uzbekistan | Immigrants from Thailand |
| Minimum | 0.84% | 2.6% |
| Maximum | 38.4% | 76.9% |
| Range | 37.6% | 74.3% |
| Mean | 12.2% | 20.2% |
| Median | 11.5% | 16.7% |
| Interquartile 25% (IQ1) | 8.0% | 13.8% |
| Interquartile 75% (IQ3) | 14.6% | 23.0% |
| Interquartile Range (IQR) | 6.6% | 9.2% |
| Standard Deviation (Sample) | 6.7% | 13.0% |
| Standard Deviation (Population) | 6.6% | 12.9% |
Similar Demographics by Female Poverty Among 25-34 Year Olds
Demographics Similar to Immigrants from Uzbekistan by Female Poverty Among 25-34 Year Olds
In terms of female poverty among 25-34 year olds, the demographic groups most similar to Immigrants from Uzbekistan are Immigrants from North America (12.9%, a difference of 0.030%), Syrian (12.9%, a difference of 0.14%), Czech (12.9%, a difference of 0.16%), Pakistani (13.0%, a difference of 0.27%), and Immigrants from Hungary (13.0%, a difference of 0.29%).
| Demographics | Rating | Rank | Female Poverty Among 25-34 Year Olds |
| Slovenes | 92.7 /100 | #123 | Exceptional 12.8% |
| Immigrants | Netherlands | 92.0 /100 | #124 | Exceptional 12.8% |
| Immigrants | Canada | 91.5 /100 | #125 | Exceptional 12.9% |
| Immigrants | Fiji | 91.2 /100 | #126 | Exceptional 12.9% |
| Czechs | 90.3 /100 | #127 | Exceptional 12.9% |
| Syrians | 90.2 /100 | #128 | Exceptional 12.9% |
| Immigrants | North America | 89.7 /100 | #129 | Excellent 12.9% |
| Immigrants | Uzbekistan | 89.6 /100 | #130 | Excellent 12.9% |
| Pakistanis | 88.4 /100 | #131 | Excellent 13.0% |
| Immigrants | Hungary | 88.3 /100 | #132 | Excellent 13.0% |
| Serbians | 87.6 /100 | #133 | Excellent 13.0% |
| Afghans | 85.8 /100 | #134 | Excellent 13.0% |
| South Africans | 85.7 /100 | #135 | Excellent 13.0% |
| Immigrants | England | 85.5 /100 | #136 | Excellent 13.0% |
| Immigrants | Chile | 84.6 /100 | #137 | Excellent 13.1% |
Demographics Similar to Immigrants from Thailand by Female Poverty Among 25-34 Year Olds
In terms of female poverty among 25-34 year olds, the demographic groups most similar to Immigrants from Thailand are Ecuadorian (14.3%, a difference of 0.0%), French Canadian (14.3%, a difference of 0.11%), Spanish American Indian (14.3%, a difference of 0.11%), Ghanaian (14.4%, a difference of 0.17%), and Sudanese (14.4%, a difference of 0.32%).
| Demographics | Rating | Rank | Female Poverty Among 25-34 Year Olds |
| Trinidadians and Tobagonians | 8.2 /100 | #211 | Tragic 14.2% |
| Immigrants | Guyana | 6.6 /100 | #212 | Tragic 14.3% |
| Puget Sound Salish | 6.5 /100 | #213 | Tragic 14.3% |
| French | 6.2 /100 | #214 | Tragic 14.3% |
| Immigrants | Nigeria | 6.2 /100 | #215 | Tragic 14.3% |
| French Canadians | 5.5 /100 | #216 | Tragic 14.3% |
| Spanish American Indians | 5.5 /100 | #217 | Tragic 14.3% |
| Immigrants | Thailand | 5.2 /100 | #218 | Tragic 14.3% |
| Ecuadorians | 5.2 /100 | #219 | Tragic 14.3% |
| Ghanaians | 4.8 /100 | #220 | Tragic 14.4% |
| Sudanese | 4.4 /100 | #221 | Tragic 14.4% |
| Immigrants | Portugal | 4.3 /100 | #222 | Tragic 14.4% |
| Nigerians | 4.2 /100 | #223 | Tragic 14.4% |
| Immigrants | Sudan | 4.0 /100 | #224 | Tragic 14.4% |
| Immigrants | Barbados | 3.4 /100 | #225 | Tragic 14.5% |