Salvadoran vs Venezuelan Child Poverty Among Boys Under 16
COMPARE
Salvadoran
Venezuelan
Child Poverty Among Boys Under 16
Child Poverty Among Boys Under 16 Comparison
Salvadorans
Venezuelans
19.0%
CHILD POVERTY AMONG BOYS UNDER 16
0.3/ 100
METRIC RATING
248th/ 347
METRIC RANK
15.7%
CHILD POVERTY AMONG BOYS UNDER 16
82.1/ 100
METRIC RATING
147th/ 347
METRIC RANK
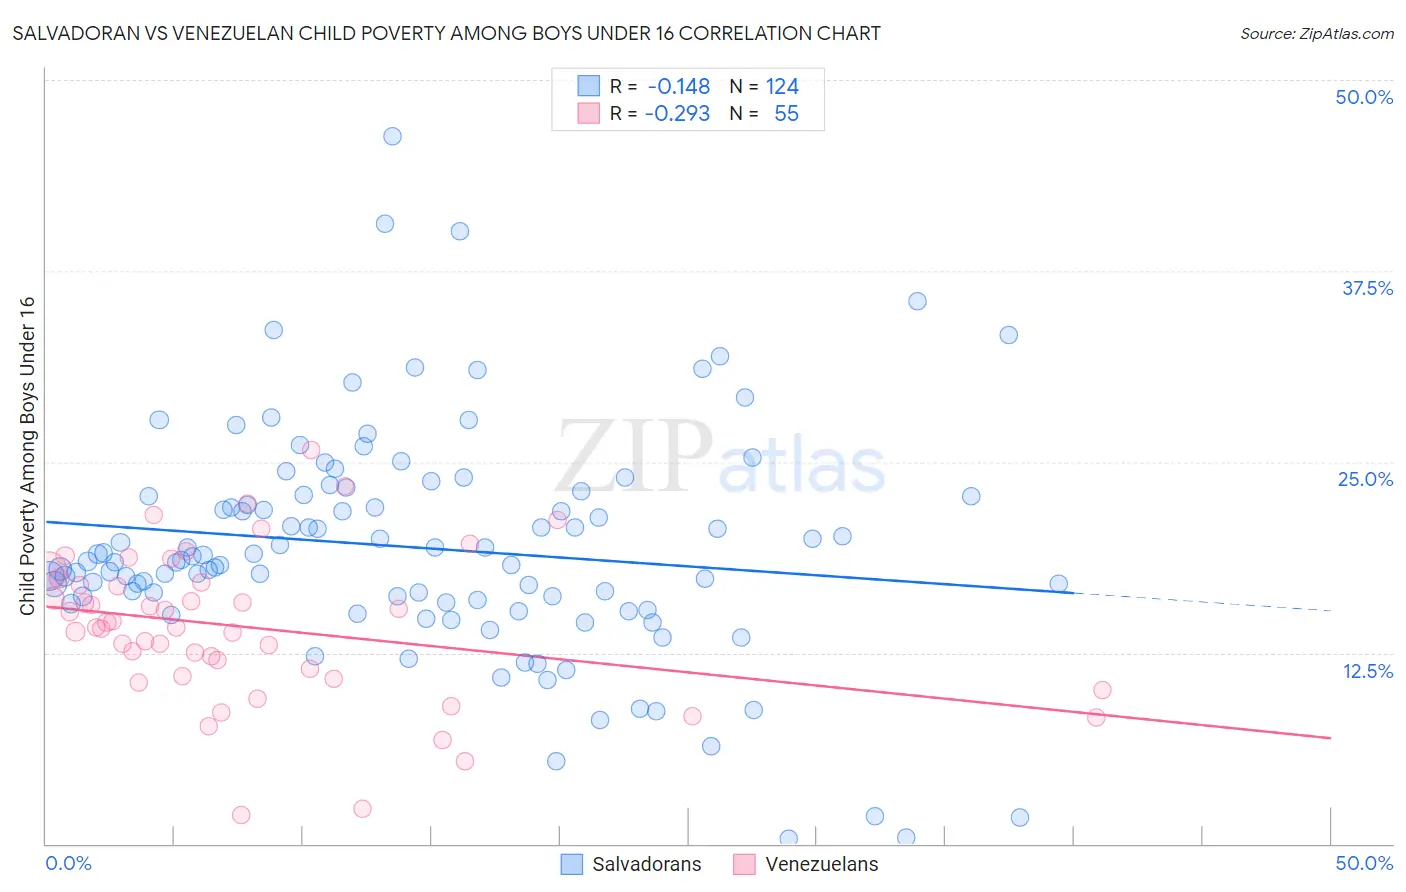
Salvadoran vs Venezuelan Child Poverty Among Boys Under 16 Correlation Chart
The statistical analysis conducted on geographies consisting of 394,231,551 people shows a poor negative correlation between the proportion of Salvadorans and poverty level among boys under the age of 16 in the United States with a correlation coefficient (R) of -0.148 and weighted average of 19.0%. Similarly, the statistical analysis conducted on geographies consisting of 302,859,424 people shows a weak negative correlation between the proportion of Venezuelans and poverty level among boys under the age of 16 in the United States with a correlation coefficient (R) of -0.293 and weighted average of 15.7%, a difference of 21.0%.
Child Poverty Among Boys Under 16 Correlation Summary
| Measurement | Salvadoran | Venezuelan |
| Minimum | 0.35% | 1.9% |
| Maximum | 46.3% | 25.8% |
| Range | 46.0% | 23.9% |
| Mean | 19.4% | 14.2% |
| Median | 18.5% | 14.2% |
| Interquartile 25% (IQ1) | 15.9% | 11.0% |
| Interquartile 75% (IQ3) | 22.8% | 17.1% |
| Interquartile Range (IQR) | 6.9% | 6.1% |
| Standard Deviation (Sample) | 7.5% | 4.9% |
| Standard Deviation (Population) | 7.5% | 4.9% |
Similar Demographics by Child Poverty Among Boys Under 16
Demographics Similar to Salvadorans by Child Poverty Among Boys Under 16
In terms of child poverty among boys under 16, the demographic groups most similar to Salvadorans are Immigrants from Trinidad and Tobago (19.0%, a difference of 0.080%), Alsatian (19.1%, a difference of 0.17%), Immigrants from Nicaragua (19.0%, a difference of 0.20%), Cree (19.0%, a difference of 0.40%), and Immigrants from Middle Africa (18.9%, a difference of 0.53%).
| Demographics | Rating | Rank | Child Poverty Among Boys Under 16 |
| Immigrants | Sudan | 0.6 /100 | #241 | Tragic 18.8% |
| Ghanaians | 0.5 /100 | #242 | Tragic 18.9% |
| Immigrants | Azores | 0.4 /100 | #243 | Tragic 18.9% |
| Immigrants | Middle Africa | 0.4 /100 | #244 | Tragic 18.9% |
| Cree | 0.4 /100 | #245 | Tragic 19.0% |
| Immigrants | Nicaragua | 0.4 /100 | #246 | Tragic 19.0% |
| Immigrants | Trinidad and Tobago | 0.3 /100 | #247 | Tragic 19.0% |
| Salvadorans | 0.3 /100 | #248 | Tragic 19.0% |
| Alsatians | 0.3 /100 | #249 | Tragic 19.1% |
| Immigrants | Burma/Myanmar | 0.2 /100 | #250 | Tragic 19.2% |
| French American Indians | 0.2 /100 | #251 | Tragic 19.2% |
| Immigrants | Western Africa | 0.2 /100 | #252 | Tragic 19.3% |
| Liberians | 0.2 /100 | #253 | Tragic 19.3% |
| Trinidadians and Tobagonians | 0.2 /100 | #254 | Tragic 19.3% |
| Ecuadorians | 0.2 /100 | #255 | Tragic 19.3% |
Demographics Similar to Venezuelans by Child Poverty Among Boys Under 16
In terms of child poverty among boys under 16, the demographic groups most similar to Venezuelans are New Zealander (15.7%, a difference of 0.070%), Brazilian (15.8%, a difference of 0.20%), Samoan (15.7%, a difference of 0.22%), Immigrants from Peru (15.7%, a difference of 0.28%), and Immigrants from Fiji (15.7%, a difference of 0.30%).
| Demographics | Rating | Rank | Child Poverty Among Boys Under 16 |
| Immigrants | Kuwait | 85.6 /100 | #140 | Excellent 15.6% |
| Slavs | 84.5 /100 | #141 | Excellent 15.7% |
| Immigrants | Hungary | 84.1 /100 | #142 | Excellent 15.7% |
| Immigrants | Fiji | 83.6 /100 | #143 | Excellent 15.7% |
| Immigrants | Peru | 83.5 /100 | #144 | Excellent 15.7% |
| Samoans | 83.2 /100 | #145 | Excellent 15.7% |
| New Zealanders | 82.4 /100 | #146 | Excellent 15.7% |
| Venezuelans | 82.1 /100 | #147 | Excellent 15.7% |
| Brazilians | 81.0 /100 | #148 | Excellent 15.8% |
| Slovaks | 80.3 /100 | #149 | Excellent 15.8% |
| Immigrants | Jordan | 80.2 /100 | #150 | Excellent 15.8% |
| Puget Sound Salish | 79.8 /100 | #151 | Good 15.8% |
| Immigrants | Venezuela | 79.5 /100 | #152 | Good 15.8% |
| French | 78.7 /100 | #153 | Good 15.8% |
| Syrians | 77.5 /100 | #154 | Good 15.9% |