Guyanese vs Immigrants from Barbados Child Poverty Among Boys Under 16
COMPARE
Guyanese
Immigrants from Barbados
Child Poverty Among Boys Under 16
Child Poverty Among Boys Under 16 Comparison
Guyanese
Immigrants from Barbados
19.6%
CHILD POVERTY AMONG BOYS UNDER 16
0.1/ 100
METRIC RATING
265th/ 347
METRIC RANK
20.0%
CHILD POVERTY AMONG BOYS UNDER 16
0.0/ 100
METRIC RATING
277th/ 347
METRIC RANK
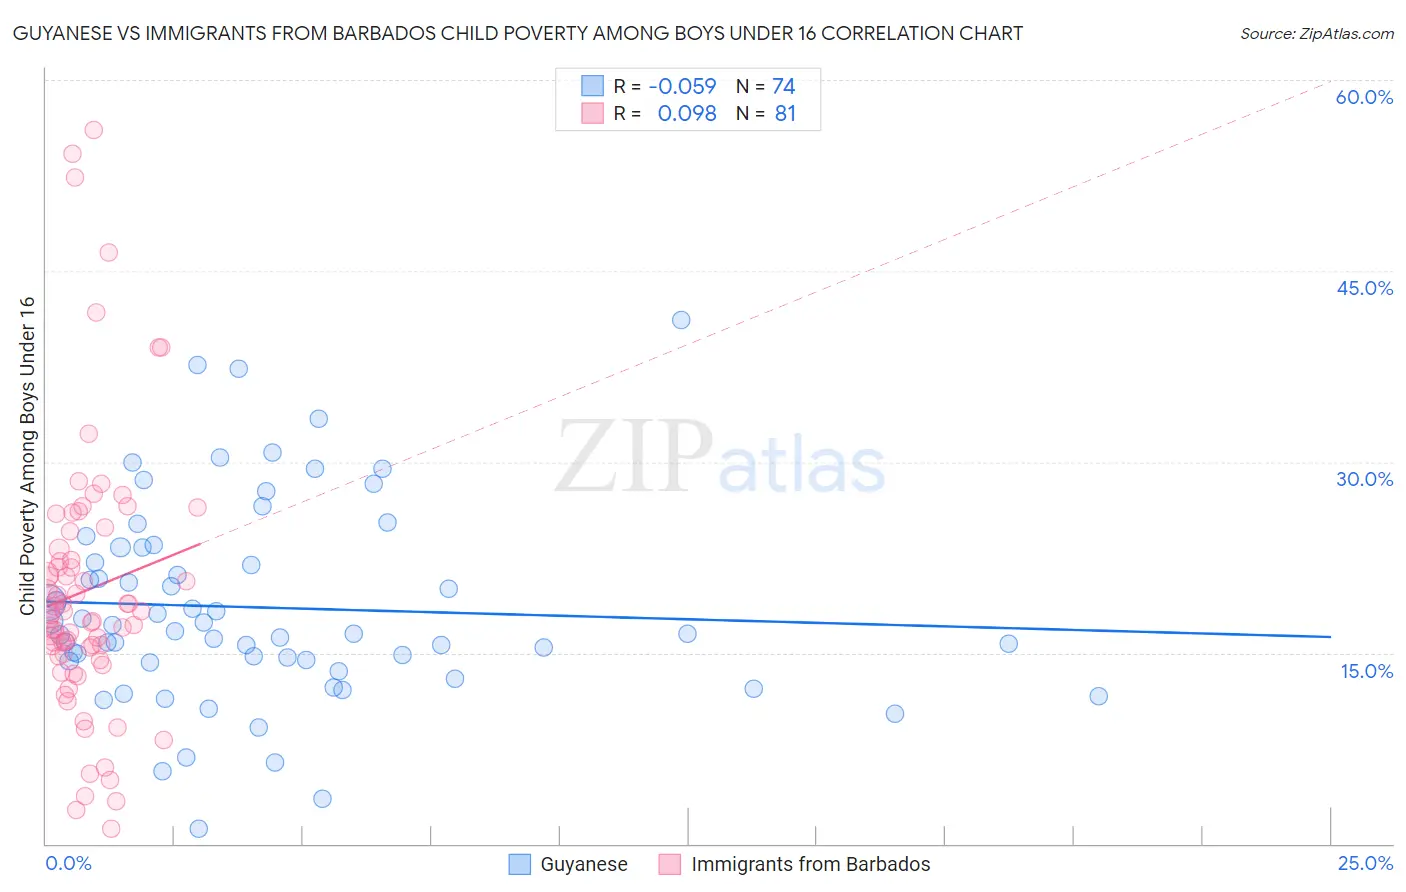
Guyanese vs Immigrants from Barbados Child Poverty Among Boys Under 16 Correlation Chart
The statistical analysis conducted on geographies consisting of 175,314,590 people shows a slight negative correlation between the proportion of Guyanese and poverty level among boys under the age of 16 in the United States with a correlation coefficient (R) of -0.059 and weighted average of 19.6%. Similarly, the statistical analysis conducted on geographies consisting of 112,373,041 people shows a slight positive correlation between the proportion of Immigrants from Barbados and poverty level among boys under the age of 16 in the United States with a correlation coefficient (R) of 0.098 and weighted average of 20.0%, a difference of 2.1%.
Child Poverty Among Boys Under 16 Correlation Summary
| Measurement | Guyanese | Immigrants from Barbados |
| Minimum | 1.2% | 1.2% |
| Maximum | 41.2% | 56.1% |
| Range | 39.9% | 54.8% |
| Mean | 18.6% | 19.9% |
| Median | 16.6% | 18.0% |
| Interquartile 25% (IQ1) | 14.3% | 14.8% |
| Interquartile 75% (IQ3) | 23.3% | 23.9% |
| Interquartile Range (IQR) | 9.0% | 9.0% |
| Standard Deviation (Sample) | 7.8% | 10.7% |
| Standard Deviation (Population) | 7.8% | 10.6% |
Demographics Similar to Guyanese and Immigrants from Barbados by Child Poverty Among Boys Under 16
In terms of child poverty among boys under 16, the demographic groups most similar to Guyanese are Immigrants from El Salvador (19.6%, a difference of 0.040%), Vietnamese (19.6%, a difference of 0.060%), Iroquois (19.6%, a difference of 0.090%), Spanish American Indian (19.6%, a difference of 0.17%), and Ottawa (19.5%, a difference of 0.32%). Similarly, the demographic groups most similar to Immigrants from Barbados are Immigrants from West Indies (20.0%, a difference of 0.020%), Subsaharan African (20.0%, a difference of 0.10%), Bangladeshi (20.0%, a difference of 0.15%), Jamaican (20.0%, a difference of 0.27%), and Central American (20.1%, a difference of 0.27%).
| Demographics | Rating | Rank | Child Poverty Among Boys Under 16 |
| Immigrants | Ghana | 0.2 /100 | #261 | Tragic 19.4% |
| Immigrants | Guyana | 0.1 /100 | #262 | Tragic 19.5% |
| Ottawa | 0.1 /100 | #263 | Tragic 19.5% |
| Iroquois | 0.1 /100 | #264 | Tragic 19.6% |
| Guyanese | 0.1 /100 | #265 | Tragic 19.6% |
| Immigrants | El Salvador | 0.1 /100 | #266 | Tragic 19.6% |
| Vietnamese | 0.1 /100 | #267 | Tragic 19.6% |
| Spanish American Indians | 0.1 /100 | #268 | Tragic 19.6% |
| Immigrants | Cabo Verde | 0.1 /100 | #269 | Tragic 19.7% |
| Cherokee | 0.1 /100 | #270 | Tragic 19.7% |
| Chickasaw | 0.1 /100 | #271 | Tragic 19.8% |
| Immigrants | Ecuador | 0.1 /100 | #272 | Tragic 19.8% |
| Belizeans | 0.1 /100 | #273 | Tragic 19.9% |
| Immigrants | Bangladesh | 0.0 /100 | #274 | Tragic 19.9% |
| Jamaicans | 0.0 /100 | #275 | Tragic 20.0% |
| Sub-Saharan Africans | 0.0 /100 | #276 | Tragic 20.0% |
| Immigrants | Barbados | 0.0 /100 | #277 | Tragic 20.0% |
| Immigrants | West Indies | 0.0 /100 | #278 | Tragic 20.0% |
| Bangladeshis | 0.0 /100 | #279 | Tragic 20.0% |
| Central Americans | 0.0 /100 | #280 | Tragic 20.1% |
| Immigrants | Zaire | 0.0 /100 | #281 | Tragic 20.1% |