Guatemalan vs Bahamian Child Poverty Under the Age of 16
COMPARE
Guatemalan
Bahamian
Child Poverty Under the Age of 16
Child Poverty Under the Age of 16 Comparison
Guatemalans
Bahamians
21.2%
CHILD POVERTY UNDER THE AGE OF 16
0.0/ 100
METRIC RATING
306th/ 347
METRIC RANK
21.5%
CHILD POVERTY UNDER THE AGE OF 16
0.0/ 100
METRIC RATING
310th/ 347
METRIC RANK
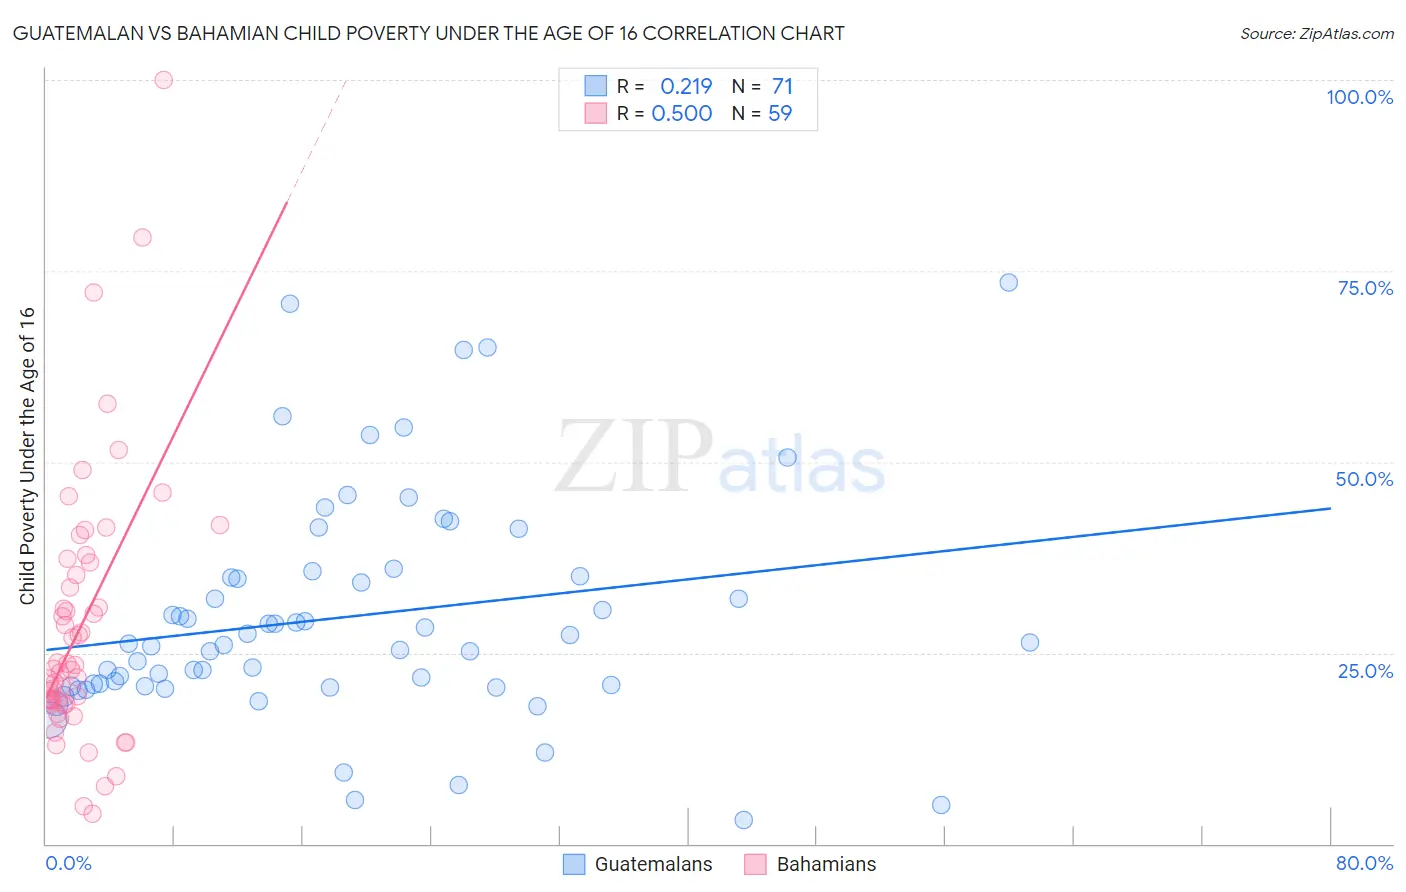
Guatemalan vs Bahamian Child Poverty Under the Age of 16 Correlation Chart
The statistical analysis conducted on geographies consisting of 406,960,077 people shows a weak positive correlation between the proportion of Guatemalans and poverty level among children under the age of 16 in the United States with a correlation coefficient (R) of 0.219 and weighted average of 21.2%. Similarly, the statistical analysis conducted on geographies consisting of 112,361,587 people shows a substantial positive correlation between the proportion of Bahamians and poverty level among children under the age of 16 in the United States with a correlation coefficient (R) of 0.500 and weighted average of 21.5%, a difference of 1.4%.
Child Poverty Under the Age of 16 Correlation Summary
| Measurement | Guatemalan | Bahamian |
| Minimum | 3.1% | 3.9% |
| Maximum | 73.5% | 100.0% |
| Range | 70.4% | 96.1% |
| Mean | 29.7% | 28.5% |
| Median | 26.2% | 22.9% |
| Interquartile 25% (IQ1) | 20.6% | 18.4% |
| Interquartile 75% (IQ3) | 35.0% | 36.8% |
| Interquartile Range (IQR) | 14.4% | 18.4% |
| Standard Deviation (Sample) | 14.7% | 17.6% |
| Standard Deviation (Population) | 14.6% | 17.4% |
Demographics Similar to Guatemalans and Bahamians by Child Poverty Under the Age of 16
In terms of child poverty under the age of 16, the demographic groups most similar to Guatemalans are Seminole (21.1%, a difference of 0.16%), Immigrants from Central America (21.3%, a difference of 0.41%), Somali (21.0%, a difference of 0.63%), Choctaw (21.0%, a difference of 0.68%), and British West Indian (21.3%, a difference of 0.70%). Similarly, the demographic groups most similar to Bahamians are Immigrants from Mexico (21.5%, a difference of 0.030%), Dutch West Indian (21.5%, a difference of 0.090%), Ute (21.5%, a difference of 0.34%), Creek (21.5%, a difference of 0.37%), and Immigrants from Somalia (21.6%, a difference of 0.58%).
| Demographics | Rating | Rank | Child Poverty Under the Age of 16 |
| Arapaho | 0.0 /100 | #298 | Tragic 20.8% |
| Immigrants | Haiti | 0.0 /100 | #299 | Tragic 20.9% |
| Indonesians | 0.0 /100 | #300 | Tragic 21.0% |
| Immigrants | Grenada | 0.0 /100 | #301 | Tragic 21.0% |
| Immigrants | Bahamas | 0.0 /100 | #302 | Tragic 21.0% |
| Choctaw | 0.0 /100 | #303 | Tragic 21.0% |
| Somalis | 0.0 /100 | #304 | Tragic 21.0% |
| Seminole | 0.0 /100 | #305 | Tragic 21.1% |
| Guatemalans | 0.0 /100 | #306 | Tragic 21.2% |
| Immigrants | Central America | 0.0 /100 | #307 | Tragic 21.3% |
| British West Indians | 0.0 /100 | #308 | Tragic 21.3% |
| Immigrants | Mexico | 0.0 /100 | #309 | Tragic 21.5% |
| Bahamians | 0.0 /100 | #310 | Tragic 21.5% |
| Dutch West Indians | 0.0 /100 | #311 | Tragic 21.5% |
| Ute | 0.0 /100 | #312 | Tragic 21.5% |
| Creek | 0.0 /100 | #313 | Tragic 21.5% |
| Immigrants | Somalia | 0.0 /100 | #314 | Tragic 21.6% |
| Immigrants | Guatemala | 0.0 /100 | #315 | Tragic 21.6% |
| Africans | 0.0 /100 | #316 | Tragic 21.7% |
| Immigrants | Dominica | 0.0 /100 | #317 | Tragic 21.9% |
| U.S. Virgin Islanders | 0.0 /100 | #318 | Tragic 22.0% |