Guamanian/Chamorro vs Immigrants from Western Asia Female Poverty Among 25-34 Year Olds
COMPARE
Guamanian/Chamorro
Immigrants from Western Asia
Female Poverty Among 25-34 Year Olds
Female Poverty Among 25-34 Year Olds Comparison
Guamanians/Chamorros
Immigrants from Western Asia
13.6%
FEMALE POVERTY AMONG 25-34 YEAR OLDS
41.5/ 100
METRIC RATING
181st/ 347
METRIC RANK
12.8%
FEMALE POVERTY AMONG 25-34 YEAR OLDS
92.7/ 100
METRIC RATING
122nd/ 347
METRIC RANK
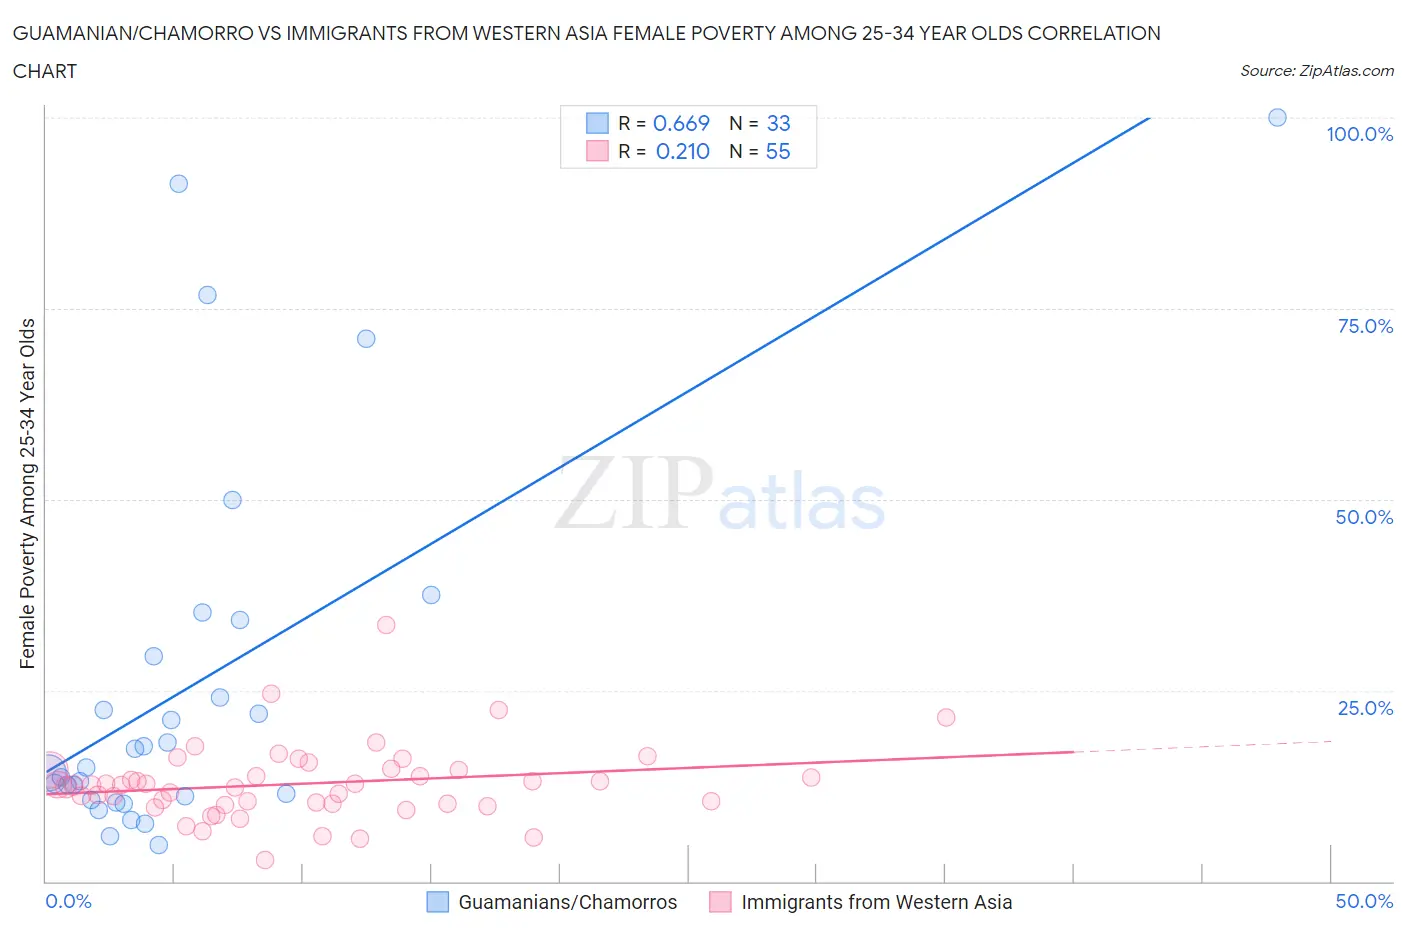
Guamanian/Chamorro vs Immigrants from Western Asia Female Poverty Among 25-34 Year Olds Correlation Chart
The statistical analysis conducted on geographies consisting of 220,375,299 people shows a significant positive correlation between the proportion of Guamanians/Chamorros and poverty level among females between the ages 25 and 34 in the United States with a correlation coefficient (R) of 0.669 and weighted average of 13.6%. Similarly, the statistical analysis conducted on geographies consisting of 397,039,286 people shows a weak positive correlation between the proportion of Immigrants from Western Asia and poverty level among females between the ages 25 and 34 in the United States with a correlation coefficient (R) of 0.210 and weighted average of 12.8%, a difference of 6.3%.
Female Poverty Among 25-34 Year Olds Correlation Summary
| Measurement | Guamanian/Chamorro | Immigrants from Western Asia |
| Minimum | 4.8% | 2.9% |
| Maximum | 100.0% | 33.5% |
| Range | 95.2% | 30.6% |
| Mean | 25.8% | 12.8% |
| Median | 14.8% | 12.6% |
| Interquartile 25% (IQ1) | 10.9% | 10.1% |
| Interquartile 75% (IQ3) | 31.8% | 14.6% |
| Interquartile Range (IQR) | 20.9% | 4.5% |
| Standard Deviation (Sample) | 24.7% | 5.0% |
| Standard Deviation (Population) | 24.3% | 4.9% |
Similar Demographics by Female Poverty Among 25-34 Year Olds
Demographics Similar to Guamanians/Chamorros by Female Poverty Among 25-34 Year Olds
In terms of female poverty among 25-34 year olds, the demographic groups most similar to Guamanians/Chamorros are German (13.6%, a difference of 0.010%), Immigrants from Venezuela (13.6%, a difference of 0.070%), Portuguese (13.6%, a difference of 0.10%), Immigrants from Eastern Africa (13.6%, a difference of 0.17%), and Canadian (13.6%, a difference of 0.24%).
| Demographics | Rating | Rank | Female Poverty Among 25-34 Year Olds |
| Immigrants | Oceania | 50.0 /100 | #174 | Average 13.5% |
| Bermudans | 46.8 /100 | #175 | Average 13.6% |
| Yugoslavians | 45.0 /100 | #176 | Average 13.6% |
| Venezuelans | 44.6 /100 | #177 | Average 13.6% |
| Canadians | 44.3 /100 | #178 | Average 13.6% |
| Immigrants | Eastern Africa | 43.6 /100 | #179 | Average 13.6% |
| Germans | 41.6 /100 | #180 | Average 13.6% |
| Guamanians/Chamorros | 41.5 /100 | #181 | Average 13.6% |
| Immigrants | Venezuela | 40.7 /100 | #182 | Average 13.6% |
| Portuguese | 40.3 /100 | #183 | Average 13.6% |
| Czechoslovakians | 36.8 /100 | #184 | Fair 13.7% |
| Irish | 35.3 /100 | #185 | Fair 13.7% |
| Immigrants | Uruguay | 34.1 /100 | #186 | Fair 13.7% |
| Slovaks | 34.1 /100 | #187 | Fair 13.7% |
| Immigrants | Eritrea | 32.7 /100 | #188 | Fair 13.7% |
Demographics Similar to Immigrants from Western Asia by Female Poverty Among 25-34 Year Olds
In terms of female poverty among 25-34 year olds, the demographic groups most similar to Immigrants from Western Asia are Romanian (12.8%, a difference of 0.020%), Slovene (12.8%, a difference of 0.020%), Carpatho Rusyn (12.8%, a difference of 0.080%), Immigrants from Nepal (12.8%, a difference of 0.090%), and Mongolian (12.8%, a difference of 0.10%).
| Demographics | Rating | Rank | Female Poverty Among 25-34 Year Olds |
| Immigrants | Brazil | 93.3 /100 | #115 | Exceptional 12.8% |
| Chileans | 93.2 /100 | #116 | Exceptional 12.8% |
| Immigrants | Kuwait | 93.1 /100 | #117 | Exceptional 12.8% |
| Mongolians | 93.0 /100 | #118 | Exceptional 12.8% |
| Immigrants | Nepal | 93.0 /100 | #119 | Exceptional 12.8% |
| Carpatho Rusyns | 93.0 /100 | #120 | Exceptional 12.8% |
| Romanians | 92.8 /100 | #121 | Exceptional 12.8% |
| Immigrants | Western Asia | 92.7 /100 | #122 | Exceptional 12.8% |
| Slovenes | 92.7 /100 | #123 | Exceptional 12.8% |
| Immigrants | Netherlands | 92.0 /100 | #124 | Exceptional 12.8% |
| Immigrants | Canada | 91.5 /100 | #125 | Exceptional 12.9% |
| Immigrants | Fiji | 91.2 /100 | #126 | Exceptional 12.9% |
| Czechs | 90.3 /100 | #127 | Exceptional 12.9% |
| Syrians | 90.2 /100 | #128 | Exceptional 12.9% |
| Immigrants | North America | 89.7 /100 | #129 | Excellent 12.9% |