Guamanian/Chamorro vs Immigrants from Spain Female Poverty Among 18-24 Year Olds
COMPARE
Guamanian/Chamorro
Immigrants from Spain
Female Poverty Among 18-24 Year Olds
Female Poverty Among 18-24 Year Olds Comparison
Guamanians/Chamorros
Immigrants from Spain
19.0%
FEMALE POVERTY AMONG 18-24 YEAR OLDS
98.8/ 100
METRIC RATING
95th/ 347
METRIC RANK
20.4%
FEMALE POVERTY AMONG 18-24 YEAR OLDS
20.7/ 100
METRIC RATING
198th/ 347
METRIC RANK
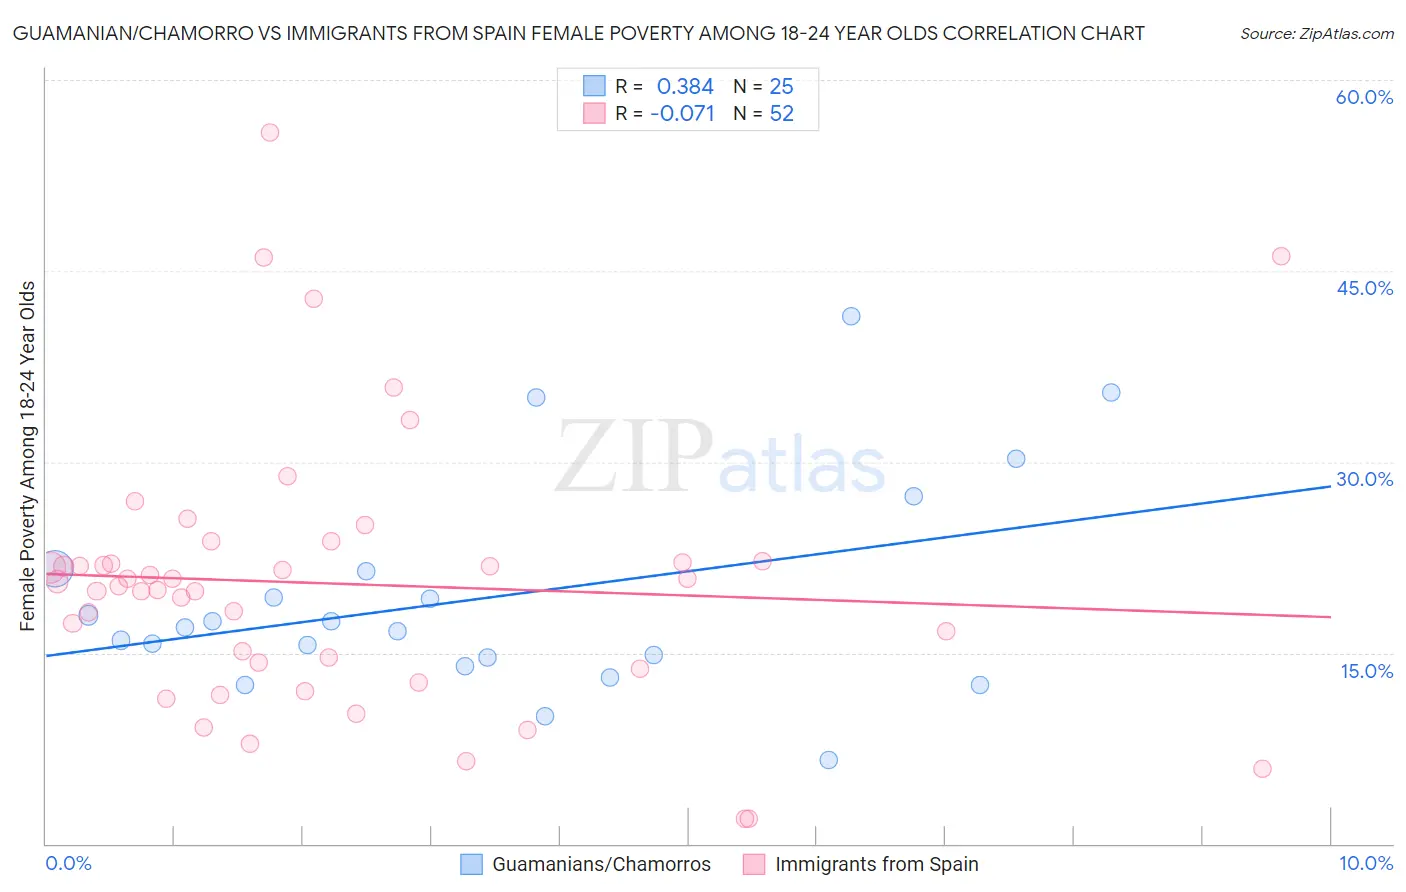
Guamanian/Chamorro vs Immigrants from Spain Female Poverty Among 18-24 Year Olds Correlation Chart
The statistical analysis conducted on geographies consisting of 219,657,100 people shows a mild positive correlation between the proportion of Guamanians/Chamorros and poverty level among females between the ages 18 and 24 in the United States with a correlation coefficient (R) of 0.384 and weighted average of 19.0%. Similarly, the statistical analysis conducted on geographies consisting of 236,171,622 people shows a slight negative correlation between the proportion of Immigrants from Spain and poverty level among females between the ages 18 and 24 in the United States with a correlation coefficient (R) of -0.071 and weighted average of 20.4%, a difference of 7.4%.
Female Poverty Among 18-24 Year Olds Correlation Summary
| Measurement | Guamanian/Chamorro | Immigrants from Spain |
| Minimum | 6.5% | 2.0% |
| Maximum | 41.5% | 55.9% |
| Range | 34.9% | 53.9% |
| Mean | 19.3% | 20.4% |
| Median | 17.0% | 20.4% |
| Interquartile 25% (IQ1) | 14.3% | 14.0% |
| Interquartile 75% (IQ3) | 21.5% | 22.2% |
| Interquartile Range (IQR) | 7.2% | 8.1% |
| Standard Deviation (Sample) | 8.4% | 10.6% |
| Standard Deviation (Population) | 8.3% | 10.5% |
Similar Demographics by Female Poverty Among 18-24 Year Olds
Demographics Similar to Guamanians/Chamorros by Female Poverty Among 18-24 Year Olds
In terms of female poverty among 18-24 year olds, the demographic groups most similar to Guamanians/Chamorros are Ukrainian (19.0%, a difference of 0.070%), Sierra Leonean (19.0%, a difference of 0.10%), Haitian (19.0%, a difference of 0.13%), Filipino (19.0%, a difference of 0.16%), and Romanian (19.0%, a difference of 0.20%).
| Demographics | Rating | Rank | Female Poverty Among 18-24 Year Olds |
| Croatians | 99.1 /100 | #88 | Exceptional 19.0% |
| Immigrants | Cabo Verde | 99.0 /100 | #89 | Exceptional 19.0% |
| Afghans | 99.0 /100 | #90 | Exceptional 19.0% |
| Romanians | 98.9 /100 | #91 | Exceptional 19.0% |
| Filipinos | 98.9 /100 | #92 | Exceptional 19.0% |
| Haitians | 98.9 /100 | #93 | Exceptional 19.0% |
| Ukrainians | 98.8 /100 | #94 | Exceptional 19.0% |
| Guamanians/Chamorros | 98.8 /100 | #95 | Exceptional 19.0% |
| Sierra Leoneans | 98.7 /100 | #96 | Exceptional 19.0% |
| Salvadorans | 98.4 /100 | #97 | Exceptional 19.1% |
| Immigrants | Jordan | 98.4 /100 | #98 | Exceptional 19.1% |
| Immigrants | Czechoslovakia | 98.3 /100 | #99 | Exceptional 19.1% |
| Chileans | 98.3 /100 | #100 | Exceptional 19.1% |
| Ecuadorians | 98.1 /100 | #101 | Exceptional 19.1% |
| Immigrants | Caribbean | 98.1 /100 | #102 | Exceptional 19.1% |
Demographics Similar to Immigrants from Spain by Female Poverty Among 18-24 Year Olds
In terms of female poverty among 18-24 year olds, the demographic groups most similar to Immigrants from Spain are German (20.4%, a difference of 0.010%), Zimbabwean (20.4%, a difference of 0.020%), European (20.4%, a difference of 0.060%), Czech (20.4%, a difference of 0.12%), and Immigrants from Latvia (20.4%, a difference of 0.16%).
| Demographics | Rating | Rank | Female Poverty Among 18-24 Year Olds |
| Moroccans | 25.8 /100 | #191 | Fair 20.4% |
| Immigrants | Israel | 24.4 /100 | #192 | Fair 20.4% |
| Nigerians | 23.4 /100 | #193 | Fair 20.4% |
| Mexican American Indians | 23.2 /100 | #194 | Fair 20.4% |
| Immigrants | Latvia | 23.0 /100 | #195 | Fair 20.4% |
| Czechs | 22.3 /100 | #196 | Fair 20.4% |
| Zimbabweans | 21.0 /100 | #197 | Fair 20.4% |
| Immigrants | Spain | 20.7 /100 | #198 | Fair 20.4% |
| Germans | 20.6 /100 | #199 | Fair 20.4% |
| Europeans | 19.9 /100 | #200 | Poor 20.4% |
| Mexicans | 18.3 /100 | #201 | Poor 20.5% |
| Immigrants | Turkey | 17.7 /100 | #202 | Poor 20.5% |
| Immigrants | Malaysia | 17.2 /100 | #203 | Poor 20.5% |
| Immigrants | Netherlands | 17.0 /100 | #204 | Poor 20.5% |
| English | 16.7 /100 | #205 | Poor 20.5% |