Guamanian/Chamorro vs South American Indian Child Poverty Under the Age of 16
COMPARE
Guamanian/Chamorro
South American Indian
Child Poverty Under the Age of 16
Child Poverty Under the Age of 16 Comparison
Guamanians/Chamorros
South American Indians
15.9%
CHILD POVERTY UNDER THE AGE OF 16
66.4/ 100
METRIC RATING
165th/ 347
METRIC RANK
16.4%
CHILD POVERTY UNDER THE AGE OF 16
41.8/ 100
METRIC RATING
180th/ 347
METRIC RANK
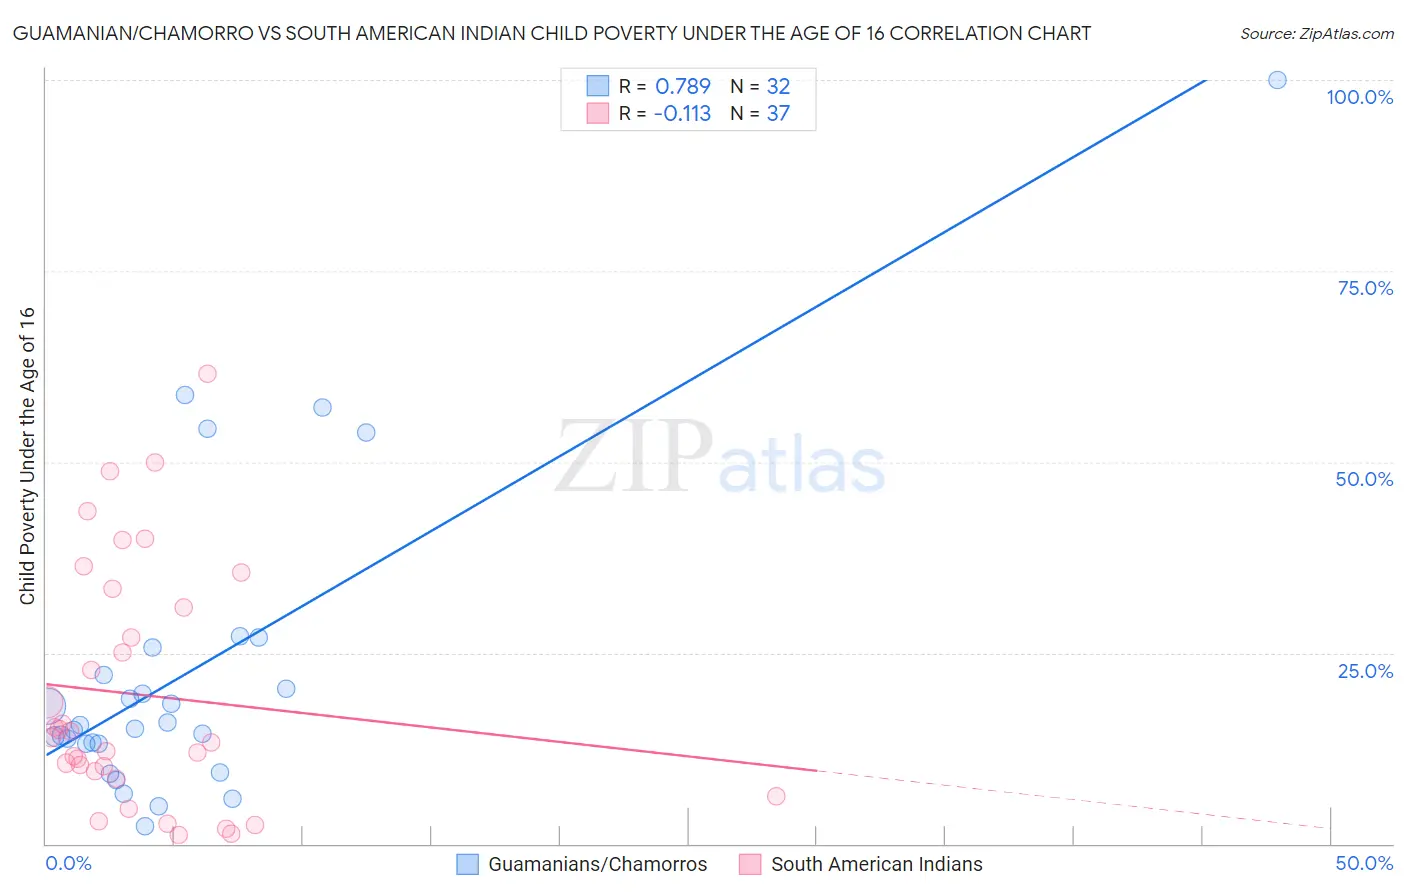
Guamanian/Chamorro vs South American Indian Child Poverty Under the Age of 16 Correlation Chart
The statistical analysis conducted on geographies consisting of 221,179,374 people shows a strong positive correlation between the proportion of Guamanians/Chamorros and poverty level among children under the age of 16 in the United States with a correlation coefficient (R) of 0.789 and weighted average of 15.9%. Similarly, the statistical analysis conducted on geographies consisting of 164,199,892 people shows a poor negative correlation between the proportion of South American Indians and poverty level among children under the age of 16 in the United States with a correlation coefficient (R) of -0.113 and weighted average of 16.4%, a difference of 3.1%.
Child Poverty Under the Age of 16 Correlation Summary
| Measurement | Guamanian/Chamorro | South American Indian |
| Minimum | 2.2% | 1.2% |
| Maximum | 100.0% | 61.5% |
| Range | 97.8% | 60.3% |
| Mean | 22.7% | 19.4% |
| Median | 15.3% | 13.9% |
| Interquartile 25% (IQ1) | 13.1% | 9.0% |
| Interquartile 75% (IQ3) | 23.9% | 32.2% |
| Interquartile Range (IQR) | 10.7% | 23.2% |
| Standard Deviation (Sample) | 20.6% | 15.8% |
| Standard Deviation (Population) | 20.3% | 15.6% |
Demographics Similar to Guamanians/Chamorros and South American Indians by Child Poverty Under the Age of 16
In terms of child poverty under the age of 16, the demographic groups most similar to Guamanians/Chamorros are Immigrants from Germany (15.8%, a difference of 0.13%), Immigrants from Oceania (15.9%, a difference of 0.13%), Colombian (15.8%, a difference of 0.17%), Yugoslavian (15.8%, a difference of 0.17%), and Costa Rican (16.0%, a difference of 0.70%). Similarly, the demographic groups most similar to South American Indians are Immigrants from Syria (16.4%, a difference of 0.050%), Immigrants from Ethiopia (16.4%, a difference of 0.060%), Immigrants from South America (16.4%, a difference of 0.12%), Ethiopian (16.3%, a difference of 0.19%), and Hawaiian (16.4%, a difference of 0.45%).
| Demographics | Rating | Rank | Child Poverty Under the Age of 16 |
| Colombians | 67.6 /100 | #162 | Good 15.8% |
| Yugoslavians | 67.6 /100 | #163 | Good 15.8% |
| Immigrants | Germany | 67.3 /100 | #164 | Good 15.8% |
| Guamanians/Chamorros | 66.4 /100 | #165 | Good 15.9% |
| Immigrants | Oceania | 65.4 /100 | #166 | Good 15.9% |
| Costa Ricans | 61.1 /100 | #167 | Good 16.0% |
| South Americans | 57.9 /100 | #168 | Average 16.0% |
| Uruguayans | 54.7 /100 | #169 | Average 16.1% |
| Immigrants | Colombia | 54.4 /100 | #170 | Average 16.1% |
| Hungarians | 52.5 /100 | #171 | Average 16.2% |
| Afghans | 52.3 /100 | #172 | Average 16.2% |
| Immigrants | Saudi Arabia | 52.1 /100 | #173 | Average 16.2% |
| Whites/Caucasians | 50.0 /100 | #174 | Average 16.2% |
| Scotch-Irish | 47.1 /100 | #175 | Average 16.3% |
| Lebanese | 45.9 /100 | #176 | Average 16.3% |
| Ethiopians | 43.4 /100 | #177 | Average 16.3% |
| Immigrants | Ethiopia | 42.3 /100 | #178 | Average 16.4% |
| Immigrants | Syria | 42.3 /100 | #179 | Average 16.4% |
| South American Indians | 41.8 /100 | #180 | Average 16.4% |
| Immigrants | South America | 40.8 /100 | #181 | Average 16.4% |
| Hawaiians | 38.2 /100 | #182 | Fair 16.4% |