Chilean vs Immigrants from Guatemala Single Female Poverty
COMPARE
Chilean
Immigrants from Guatemala
Single Female Poverty
Single Female Poverty Comparison
Chileans
Immigrants from Guatemala
19.9%
SINGLE FEMALE POVERTY
96.9/ 100
METRIC RATING
104th/ 347
METRIC RANK
24.1%
SINGLE FEMALE POVERTY
0.0/ 100
METRIC RATING
285th/ 347
METRIC RANK
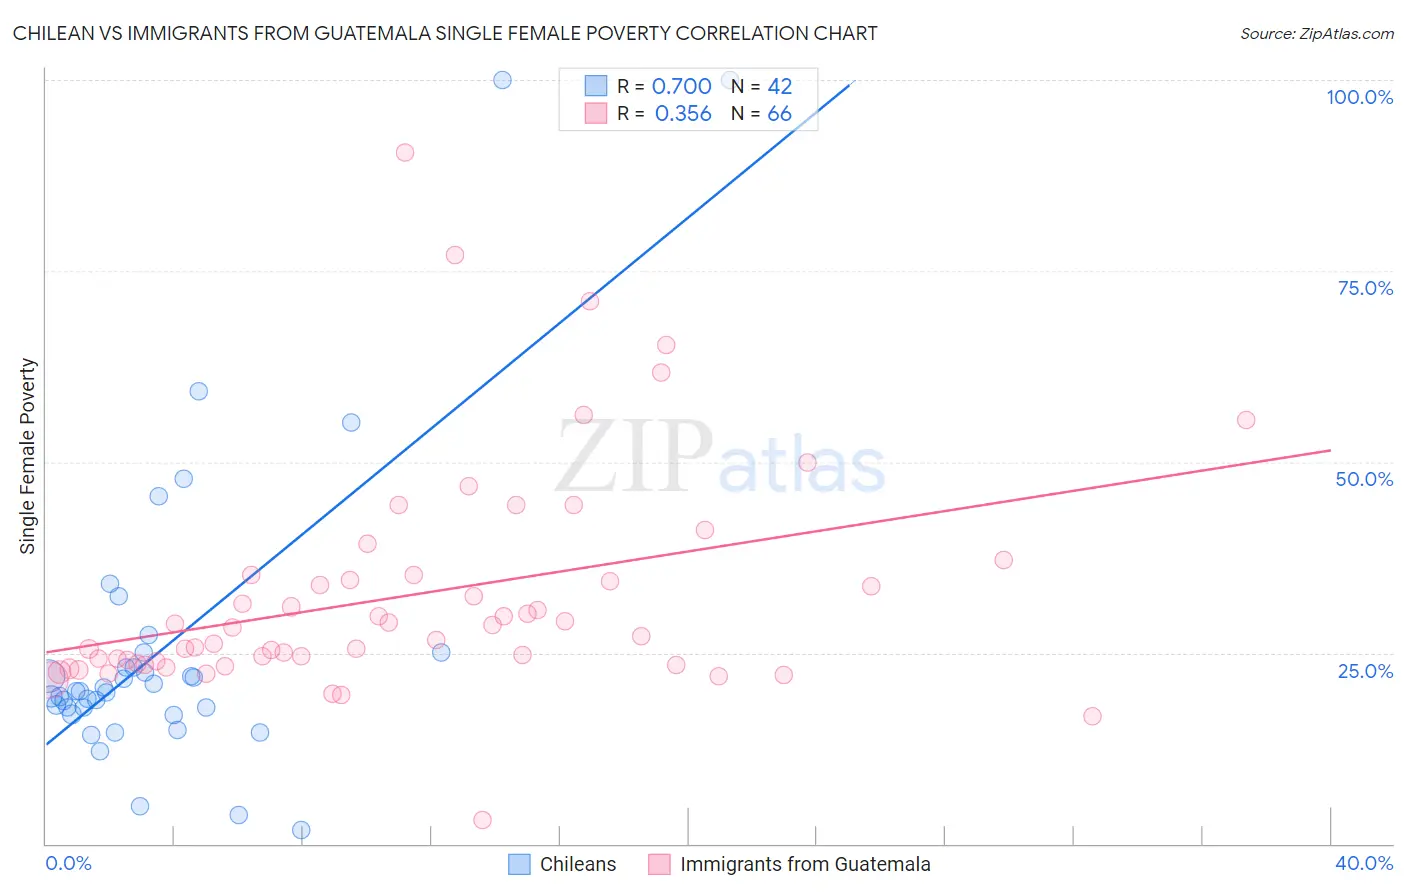
Chilean vs Immigrants from Guatemala Single Female Poverty Correlation Chart
The statistical analysis conducted on geographies consisting of 254,415,237 people shows a strong positive correlation between the proportion of Chileans and poverty level among single females in the United States with a correlation coefficient (R) of 0.700 and weighted average of 19.9%. Similarly, the statistical analysis conducted on geographies consisting of 373,364,568 people shows a mild positive correlation between the proportion of Immigrants from Guatemala and poverty level among single females in the United States with a correlation coefficient (R) of 0.356 and weighted average of 24.1%, a difference of 21.3%.
Single Female Poverty Correlation Summary
| Measurement | Chilean | Immigrants from Guatemala |
| Minimum | 1.8% | 3.0% |
| Maximum | 100.0% | 90.5% |
| Range | 98.2% | 87.4% |
| Mean | 25.9% | 32.5% |
| Median | 19.9% | 27.7% |
| Interquartile 25% (IQ1) | 17.8% | 23.6% |
| Interquartile 75% (IQ3) | 25.0% | 35.1% |
| Interquartile Range (IQR) | 7.2% | 11.5% |
| Standard Deviation (Sample) | 20.4% | 15.0% |
| Standard Deviation (Population) | 20.1% | 14.9% |
Similar Demographics by Single Female Poverty
Demographics Similar to Chileans by Single Female Poverty
In terms of single female poverty, the demographic groups most similar to Chileans are Israeli (19.9%, a difference of 0.010%), Ethiopian (19.9%, a difference of 0.10%), Immigrants from Southern Europe (19.9%, a difference of 0.12%), Immigrants from Syria (19.9%, a difference of 0.12%), and Native Hawaiian (19.9%, a difference of 0.17%).
| Demographics | Rating | Rank | Single Female Poverty |
| Croatians | 98.1 /100 | #97 | Exceptional 19.7% |
| Immigrants | France | 97.9 /100 | #98 | Exceptional 19.7% |
| Sierra Leoneans | 97.9 /100 | #99 | Exceptional 19.7% |
| Ukrainians | 97.6 /100 | #100 | Exceptional 19.8% |
| Immigrants | Belgium | 97.3 /100 | #101 | Exceptional 19.8% |
| Immigrants | Cameroon | 97.3 /100 | #102 | Exceptional 19.8% |
| Immigrants | Southern Europe | 97.1 /100 | #103 | Exceptional 19.9% |
| Chileans | 96.9 /100 | #104 | Exceptional 19.9% |
| Israelis | 96.9 /100 | #105 | Exceptional 19.9% |
| Ethiopians | 96.7 /100 | #106 | Exceptional 19.9% |
| Immigrants | Syria | 96.7 /100 | #107 | Exceptional 19.9% |
| Native Hawaiians | 96.6 /100 | #108 | Exceptional 19.9% |
| Colombians | 96.6 /100 | #109 | Exceptional 19.9% |
| Immigrants | Western Asia | 96.5 /100 | #110 | Exceptional 19.9% |
| Carpatho Rusyns | 96.1 /100 | #111 | Exceptional 20.0% |
Demographics Similar to Immigrants from Guatemala by Single Female Poverty
In terms of single female poverty, the demographic groups most similar to Immigrants from Guatemala are Cree (24.1%, a difference of 0.040%), Bangladeshi (24.2%, a difference of 0.19%), Spanish American (24.2%, a difference of 0.21%), U.S. Virgin Islander (24.2%, a difference of 0.26%), and Indonesian (24.3%, a difference of 0.60%).
| Demographics | Rating | Rank | Single Female Poverty |
| Immigrants | Nonimmigrants | 0.0 /100 | #278 | Tragic 23.6% |
| Alaskan Athabascans | 0.0 /100 | #279 | Tragic 23.6% |
| Immigrants | Latin America | 0.0 /100 | #280 | Tragic 23.7% |
| Immigrants | Zaire | 0.0 /100 | #281 | Tragic 23.8% |
| Guatemalans | 0.0 /100 | #282 | Tragic 23.8% |
| German Russians | 0.0 /100 | #283 | Tragic 23.9% |
| Immigrants | Dominica | 0.0 /100 | #284 | Tragic 23.9% |
| Immigrants | Guatemala | 0.0 /100 | #285 | Tragic 24.1% |
| Cree | 0.0 /100 | #286 | Tragic 24.1% |
| Bangladeshis | 0.0 /100 | #287 | Tragic 24.2% |
| Spanish Americans | 0.0 /100 | #288 | Tragic 24.2% |
| U.S. Virgin Islanders | 0.0 /100 | #289 | Tragic 24.2% |
| Indonesians | 0.0 /100 | #290 | Tragic 24.3% |
| Osage | 0.0 /100 | #291 | Tragic 24.4% |
| Alsatians | 0.0 /100 | #292 | Tragic 24.5% |