Guamanian/Chamorro vs Immigrants from Guatemala 8th Grade
COMPARE
Guamanian/Chamorro
Immigrants from Guatemala
8th Grade
8th Grade Comparison
Guamanians/Chamorros
Immigrants from Guatemala
95.6%
8TH GRADE
26.6/ 100
METRIC RATING
194th/ 347
METRIC RANK
90.7%
8TH GRADE
0.0/ 100
METRIC RATING
343rd/ 347
METRIC RANK
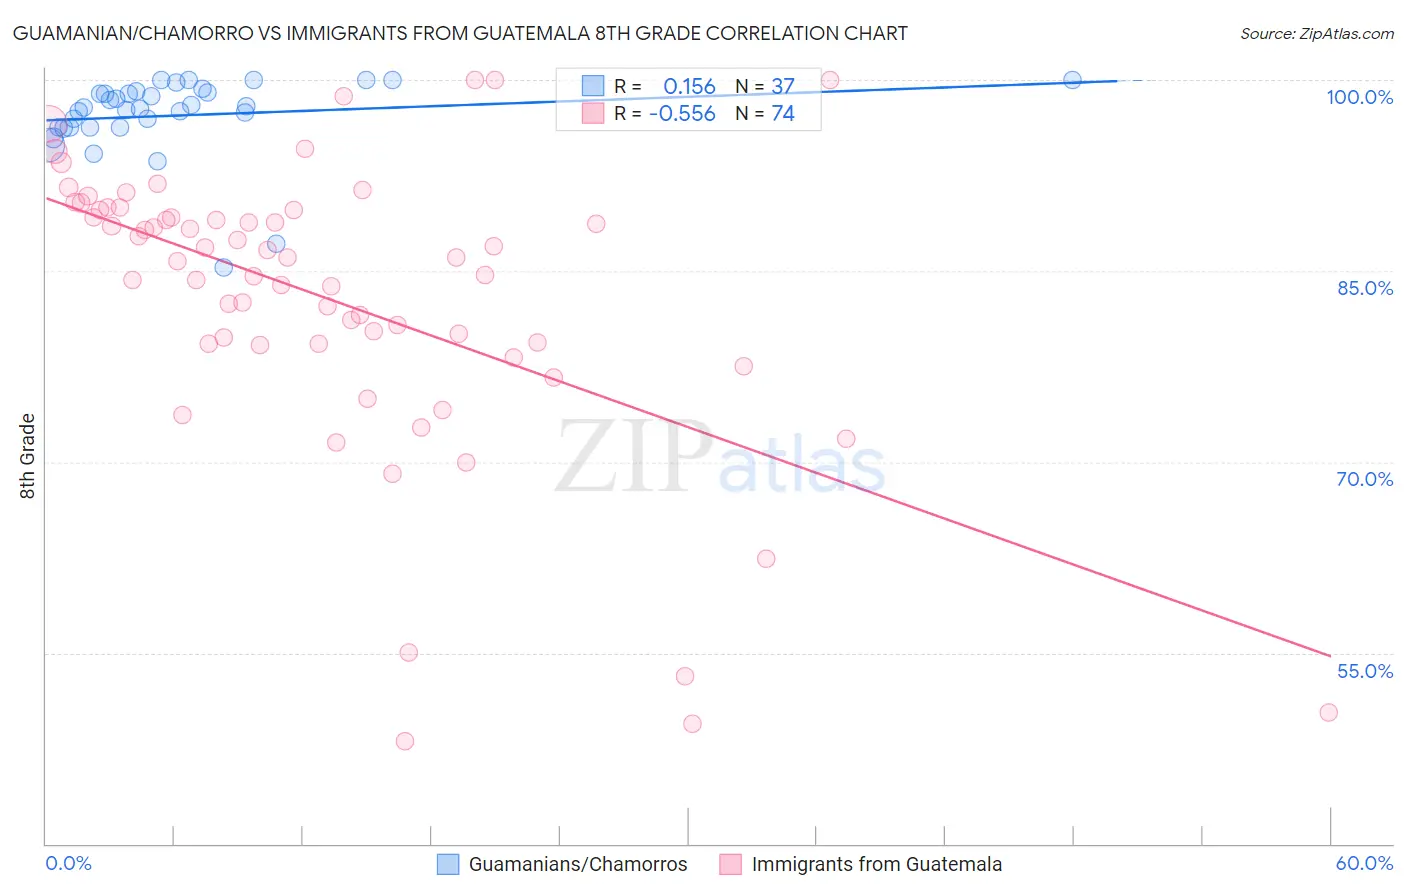
Guamanian/Chamorro vs Immigrants from Guatemala 8th Grade Correlation Chart
The statistical analysis conducted on geographies consisting of 221,965,618 people shows a poor positive correlation between the proportion of Guamanians/Chamorros and percentage of population with at least 8th grade education in the United States with a correlation coefficient (R) of 0.156 and weighted average of 95.6%. Similarly, the statistical analysis conducted on geographies consisting of 377,286,142 people shows a substantial negative correlation between the proportion of Immigrants from Guatemala and percentage of population with at least 8th grade education in the United States with a correlation coefficient (R) of -0.556 and weighted average of 90.7%, a difference of 5.3%.
8th Grade Correlation Summary
| Measurement | Guamanian/Chamorro | Immigrants from Guatemala |
| Minimum | 85.2% | 48.1% |
| Maximum | 100.0% | 100.0% |
| Range | 14.8% | 51.9% |
| Mean | 97.2% | 82.8% |
| Median | 97.8% | 85.9% |
| Interquartile 25% (IQ1) | 96.3% | 79.2% |
| Interquartile 75% (IQ3) | 99.1% | 89.8% |
| Interquartile Range (IQR) | 2.8% | 10.5% |
| Standard Deviation (Sample) | 3.2% | 11.4% |
| Standard Deviation (Population) | 3.1% | 11.3% |
Similar Demographics by 8th Grade
Demographics Similar to Guamanians/Chamorros by 8th Grade
In terms of 8th grade, the demographic groups most similar to Guamanians/Chamorros are Panamanian (95.6%, a difference of 0.010%), Immigrants from Zaire (95.6%, a difference of 0.010%), Pima (95.6%, a difference of 0.020%), Assyrian/Chaldean/Syriac (95.6%, a difference of 0.020%), and Sierra Leonean (95.6%, a difference of 0.020%).
| Demographics | Rating | Rank | 8th Grade |
| Sudanese | 33.0 /100 | #187 | Fair 95.6% |
| Liberians | 32.4 /100 | #188 | Fair 95.6% |
| Immigrants | Micronesia | 31.6 /100 | #189 | Fair 95.6% |
| Immigrants | Venezuela | 30.8 /100 | #190 | Fair 95.6% |
| Immigrants | Nepal | 30.2 /100 | #191 | Fair 95.6% |
| Pima | 28.6 /100 | #192 | Fair 95.6% |
| Panamanians | 28.4 /100 | #193 | Fair 95.6% |
| Guamanians/Chamorros | 26.6 /100 | #194 | Fair 95.6% |
| Immigrants | Zaire | 25.2 /100 | #195 | Fair 95.6% |
| Assyrians/Chaldeans/Syriacs | 24.5 /100 | #196 | Fair 95.6% |
| Sierra Leoneans | 24.3 /100 | #197 | Fair 95.6% |
| Paraguayans | 22.6 /100 | #198 | Fair 95.5% |
| Immigrants | Northern Africa | 22.5 /100 | #199 | Fair 95.5% |
| Argentineans | 22.2 /100 | #200 | Fair 95.5% |
| Immigrants | Argentina | 20.6 /100 | #201 | Fair 95.5% |
Demographics Similar to Immigrants from Guatemala by 8th Grade
In terms of 8th grade, the demographic groups most similar to Immigrants from Guatemala are Salvadoran (90.9%, a difference of 0.17%), Immigrants from Central America (90.4%, a difference of 0.37%), Guatemalan (91.1%, a difference of 0.46%), Immigrants from El Salvador (90.3%, a difference of 0.46%), and Yakama (91.2%, a difference of 0.57%).
| Demographics | Rating | Rank | 8th Grade |
| Hispanics or Latinos | 0.0 /100 | #333 | Tragic 92.2% |
| Immigrants | Yemen | 0.0 /100 | #334 | Tragic 92.1% |
| Mexican American Indians | 0.0 /100 | #335 | Tragic 92.1% |
| Immigrants | Honduras | 0.0 /100 | #336 | Tragic 91.9% |
| Immigrants | Latin America | 0.0 /100 | #337 | Tragic 91.7% |
| Central Americans | 0.0 /100 | #338 | Tragic 91.6% |
| Mexicans | 0.0 /100 | #339 | Tragic 91.4% |
| Yakama | 0.0 /100 | #340 | Tragic 91.2% |
| Guatemalans | 0.0 /100 | #341 | Tragic 91.1% |
| Salvadorans | 0.0 /100 | #342 | Tragic 90.9% |
| Immigrants | Guatemala | 0.0 /100 | #343 | Tragic 90.7% |
| Immigrants | Central America | 0.0 /100 | #344 | Tragic 90.4% |
| Immigrants | El Salvador | 0.0 /100 | #345 | Tragic 90.3% |
| Immigrants | Mexico | 0.0 /100 | #346 | Tragic 90.2% |
| Spanish American Indians | 0.0 /100 | #347 | Tragic 89.8% |