Marshallese vs Immigrants from Cuba Seniors Poverty Over the Age of 65
COMPARE
Marshallese
Immigrants from Cuba
Seniors Poverty Over the Age of 65
Seniors Poverty Over the Age of 65 Comparison
Marshallese
Immigrants from Cuba
10.2%
SENIORS POVERTY OVER THE AGE OF 65
95.3/ 100
METRIC RATING
100th/ 347
METRIC RANK
17.9%
SENIORS POVERTY OVER THE AGE OF 65
0.0/ 100
METRIC RATING
342nd/ 347
METRIC RANK
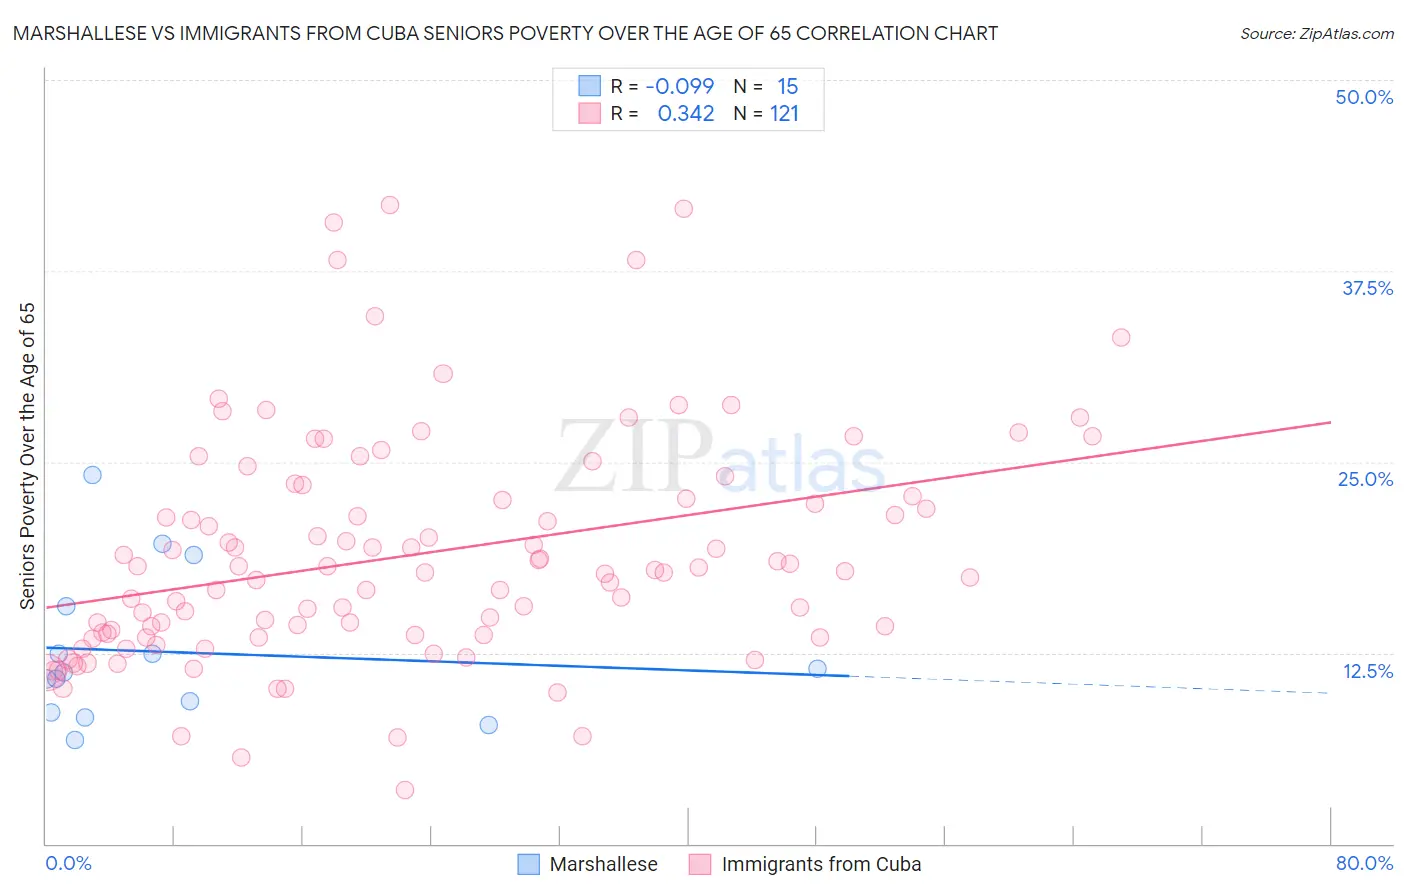
Marshallese vs Immigrants from Cuba Seniors Poverty Over the Age of 65 Correlation Chart
The statistical analysis conducted on geographies consisting of 14,747,629 people shows a slight negative correlation between the proportion of Marshallese and poverty level among seniors over the age of 65 in the United States with a correlation coefficient (R) of -0.099 and weighted average of 10.2%. Similarly, the statistical analysis conducted on geographies consisting of 325,352,793 people shows a mild positive correlation between the proportion of Immigrants from Cuba and poverty level among seniors over the age of 65 in the United States with a correlation coefficient (R) of 0.342 and weighted average of 17.9%, a difference of 75.8%.
Seniors Poverty Over the Age of 65 Correlation Summary
| Measurement | Marshallese | Immigrants from Cuba |
| Minimum | 6.8% | 3.5% |
| Maximum | 24.1% | 41.8% |
| Range | 17.3% | 38.3% |
| Mean | 12.5% | 18.9% |
| Median | 11.2% | 17.9% |
| Interquartile 25% (IQ1) | 8.6% | 13.7% |
| Interquartile 75% (IQ3) | 15.5% | 22.6% |
| Interquartile Range (IQR) | 6.9% | 8.9% |
| Standard Deviation (Sample) | 4.9% | 7.5% |
| Standard Deviation (Population) | 4.8% | 7.4% |
Similar Demographics by Seniors Poverty Over the Age of 65
Demographics Similar to Marshallese by Seniors Poverty Over the Age of 65
In terms of seniors poverty over the age of 65, the demographic groups most similar to Marshallese are Immigrants from Kuwait (10.2%, a difference of 0.070%), Cypriot (10.2%, a difference of 0.070%), Immigrants from Pakistan (10.2%, a difference of 0.23%), Basque (10.2%, a difference of 0.31%), and Immigrants from Jordan (10.2%, a difference of 0.32%).
| Demographics | Rating | Rank | Seniors Poverty Over the Age of 65 |
| Immigrants | Sweden | 96.7 /100 | #93 | Exceptional 10.1% |
| Immigrants | Germany | 96.7 /100 | #94 | Exceptional 10.1% |
| Immigrants | Japan | 96.3 /100 | #95 | Exceptional 10.1% |
| Basques | 95.9 /100 | #96 | Exceptional 10.2% |
| Immigrants | Pakistan | 95.7 /100 | #97 | Exceptional 10.2% |
| Immigrants | Kuwait | 95.5 /100 | #98 | Exceptional 10.2% |
| Cypriots | 95.5 /100 | #99 | Exceptional 10.2% |
| Marshallese | 95.3 /100 | #100 | Exceptional 10.2% |
| Immigrants | Jordan | 94.7 /100 | #101 | Exceptional 10.2% |
| Delaware | 94.5 /100 | #102 | Exceptional 10.2% |
| Icelanders | 94.4 /100 | #103 | Exceptional 10.3% |
| South Africans | 94.3 /100 | #104 | Exceptional 10.3% |
| Aleuts | 94.1 /100 | #105 | Exceptional 10.3% |
| Kenyans | 94.1 /100 | #106 | Exceptional 10.3% |
| Hawaiians | 93.9 /100 | #107 | Exceptional 10.3% |
Demographics Similar to Immigrants from Cuba by Seniors Poverty Over the Age of 65
In terms of seniors poverty over the age of 65, the demographic groups most similar to Immigrants from Cuba are Dominican (17.8%, a difference of 0.48%), Hopi (17.8%, a difference of 0.87%), Lumbee (18.1%, a difference of 1.1%), Immigrants from Dominican Republic (18.3%, a difference of 2.0%), and Navajo (17.5%, a difference of 2.8%).
| Demographics | Rating | Rank | Seniors Poverty Over the Age of 65 |
| Immigrants | Yemen | 0.0 /100 | #333 | Tragic 15.9% |
| Immigrants | Nicaragua | 0.0 /100 | #334 | Tragic 15.9% |
| Cubans | 0.0 /100 | #335 | Tragic 16.1% |
| Immigrants | Cabo Verde | 0.0 /100 | #336 | Tragic 16.2% |
| Immigrants | Caribbean | 0.0 /100 | #337 | Tragic 16.5% |
| Pueblo | 0.0 /100 | #338 | Tragic 17.2% |
| Navajo | 0.0 /100 | #339 | Tragic 17.5% |
| Hopi | 0.0 /100 | #340 | Tragic 17.8% |
| Dominicans | 0.0 /100 | #341 | Tragic 17.8% |
| Immigrants | Cuba | 0.0 /100 | #342 | Tragic 17.9% |
| Lumbee | 0.0 /100 | #343 | Tragic 18.1% |
| Immigrants | Dominican Republic | 0.0 /100 | #344 | Tragic 18.3% |
| Pima | 0.0 /100 | #345 | Tragic 19.8% |
| Tohono O'odham | 0.0 /100 | #346 | Tragic 20.8% |
| Puerto Ricans | 0.0 /100 | #347 | Tragic 21.4% |