German vs Immigrants from Nigeria Single Mother Poverty
COMPARE
German
Immigrants from Nigeria
Single Mother Poverty
Single Mother Poverty Comparison
Germans
Immigrants from Nigeria
30.0%
SINGLE MOTHER POVERTY
8.8/ 100
METRIC RATING
220th/ 347
METRIC RANK
28.9%
SINGLE MOTHER POVERTY
65.9/ 100
METRIC RATING
163rd/ 347
METRIC RANK
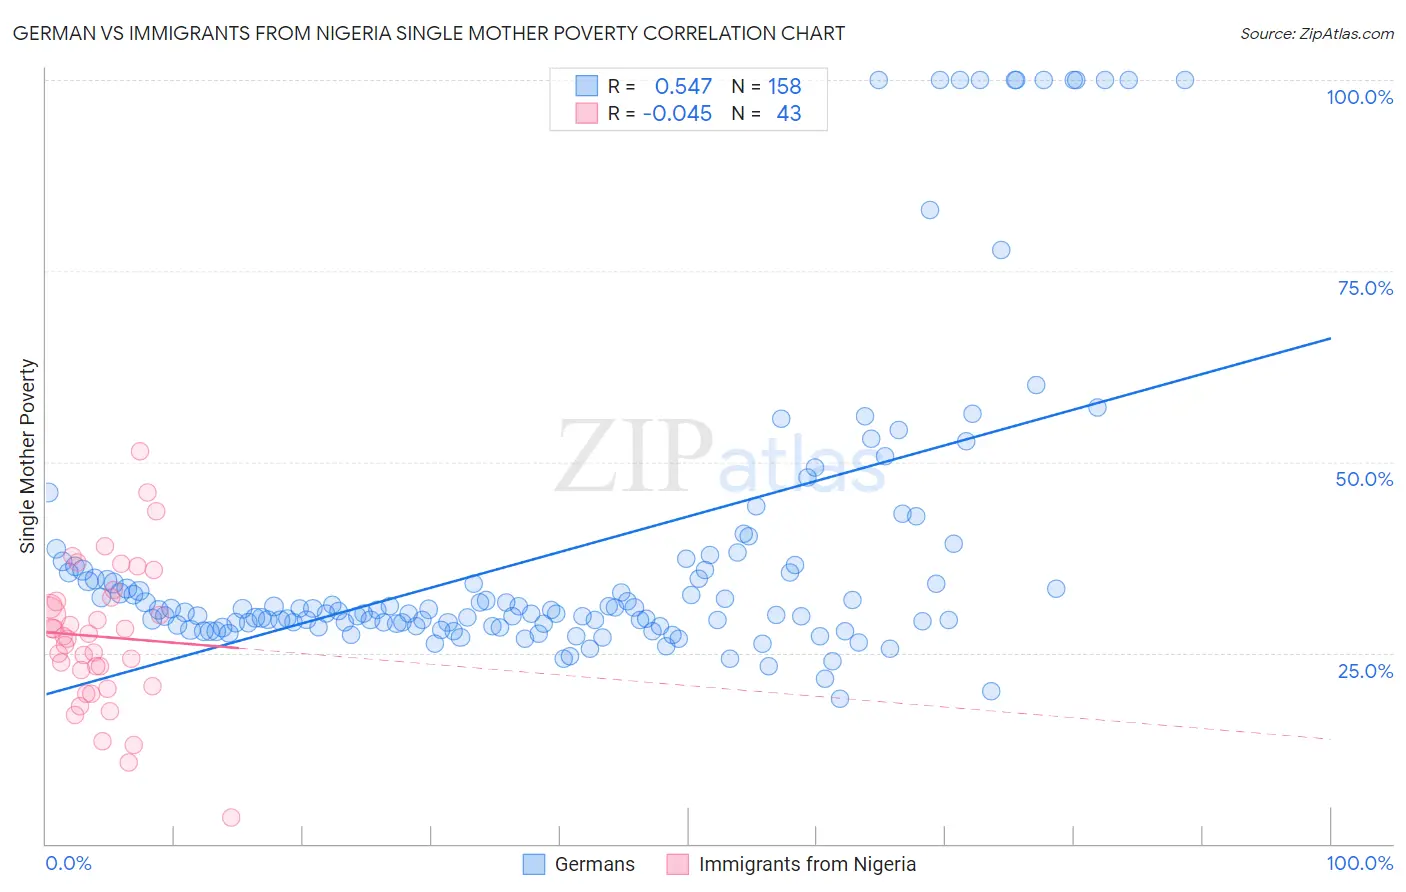
German vs Immigrants from Nigeria Single Mother Poverty Correlation Chart
The statistical analysis conducted on geographies consisting of 549,975,731 people shows a substantial positive correlation between the proportion of Germans and poverty level among single mothers in the United States with a correlation coefficient (R) of 0.547 and weighted average of 30.0%. Similarly, the statistical analysis conducted on geographies consisting of 280,043,423 people shows no correlation between the proportion of Immigrants from Nigeria and poverty level among single mothers in the United States with a correlation coefficient (R) of -0.045 and weighted average of 28.9%, a difference of 3.6%.
Single Mother Poverty Correlation Summary
| Measurement | German | Immigrants from Nigeria |
| Minimum | 18.9% | 3.4% |
| Maximum | 100.0% | 51.4% |
| Range | 81.1% | 47.9% |
| Mean | 38.1% | 27.1% |
| Median | 30.6% | 27.2% |
| Interquartile 25% (IQ1) | 28.8% | 20.7% |
| Interquartile 75% (IQ3) | 35.8% | 32.3% |
| Interquartile Range (IQR) | 7.1% | 11.7% |
| Standard Deviation (Sample) | 19.9% | 9.4% |
| Standard Deviation (Population) | 19.9% | 9.3% |
Similar Demographics by Single Mother Poverty
Demographics Similar to Germans by Single Mother Poverty
In terms of single mother poverty, the demographic groups most similar to Germans are Finnish (30.0%, a difference of 0.070%), Immigrants from Eritrea (30.0%, a difference of 0.17%), Sudanese (30.0%, a difference of 0.18%), Hungarian (29.9%, a difference of 0.21%), and Immigrants from Cuba (30.1%, a difference of 0.31%).
| Demographics | Rating | Rank | Single Mother Poverty |
| Immigrants | Thailand | 12.0 /100 | #213 | Poor 29.9% |
| Liberians | 11.7 /100 | #214 | Poor 29.9% |
| Jamaicans | 11.7 /100 | #215 | Poor 29.9% |
| Immigrants | Western Africa | 11.5 /100 | #216 | Poor 29.9% |
| Immigrants | Ghana | 11.3 /100 | #217 | Poor 29.9% |
| Hungarians | 10.3 /100 | #218 | Poor 29.9% |
| Finns | 9.3 /100 | #219 | Tragic 30.0% |
| Germans | 8.8 /100 | #220 | Tragic 30.0% |
| Immigrants | Eritrea | 7.7 /100 | #221 | Tragic 30.0% |
| Sudanese | 7.6 /100 | #222 | Tragic 30.0% |
| Immigrants | Cuba | 6.9 /100 | #223 | Tragic 30.1% |
| Immigrants | Sudan | 6.5 /100 | #224 | Tragic 30.1% |
| Spanish | 6.3 /100 | #225 | Tragic 30.1% |
| Scottish | 6.0 /100 | #226 | Tragic 30.1% |
| Immigrants | Liberia | 5.9 /100 | #227 | Tragic 30.1% |
Demographics Similar to Immigrants from Nigeria by Single Mother Poverty
In terms of single mother poverty, the demographic groups most similar to Immigrants from Nigeria are Immigrants from Kenya (28.9%, a difference of 0.0%), Scandinavian (28.9%, a difference of 0.020%), Immigrants from Cambodia (28.9%, a difference of 0.040%), Japanese (28.9%, a difference of 0.11%), and Czech (28.9%, a difference of 0.14%).
| Demographics | Rating | Rank | Single Mother Poverty |
| Iraqis | 71.5 /100 | #156 | Good 28.8% |
| Immigrants | Western Europe | 71.1 /100 | #157 | Good 28.9% |
| Immigrants | Hungary | 70.6 /100 | #158 | Good 28.9% |
| Czechs | 68.4 /100 | #159 | Good 28.9% |
| Japanese | 68.0 /100 | #160 | Good 28.9% |
| Immigrants | Cambodia | 66.6 /100 | #161 | Good 28.9% |
| Scandinavians | 66.2 /100 | #162 | Good 28.9% |
| Immigrants | Nigeria | 65.9 /100 | #163 | Good 28.9% |
| Immigrants | Kenya | 65.9 /100 | #164 | Good 28.9% |
| Arabs | 60.7 /100 | #165 | Good 29.0% |
| Inupiat | 60.4 /100 | #166 | Good 29.0% |
| Costa Ricans | 58.4 /100 | #167 | Average 29.0% |
| Europeans | 57.6 /100 | #168 | Average 29.1% |
| Immigrants | Uruguay | 57.2 /100 | #169 | Average 29.1% |
| New Zealanders | 55.1 /100 | #170 | Average 29.1% |