German Russian vs Spanish American Female Poverty Among 18-24 Year Olds
COMPARE
German Russian
Spanish American
Female Poverty Among 18-24 Year Olds
Female Poverty Among 18-24 Year Olds Comparison
German Russians
Spanish Americans
25.2%
FEMALE POVERTY AMONG 18-24 YEAR OLDS
0.0/ 100
METRIC RATING
324th/ 347
METRIC RANK
21.9%
FEMALE POVERTY AMONG 18-24 YEAR OLDS
0.1/ 100
METRIC RATING
279th/ 347
METRIC RANK
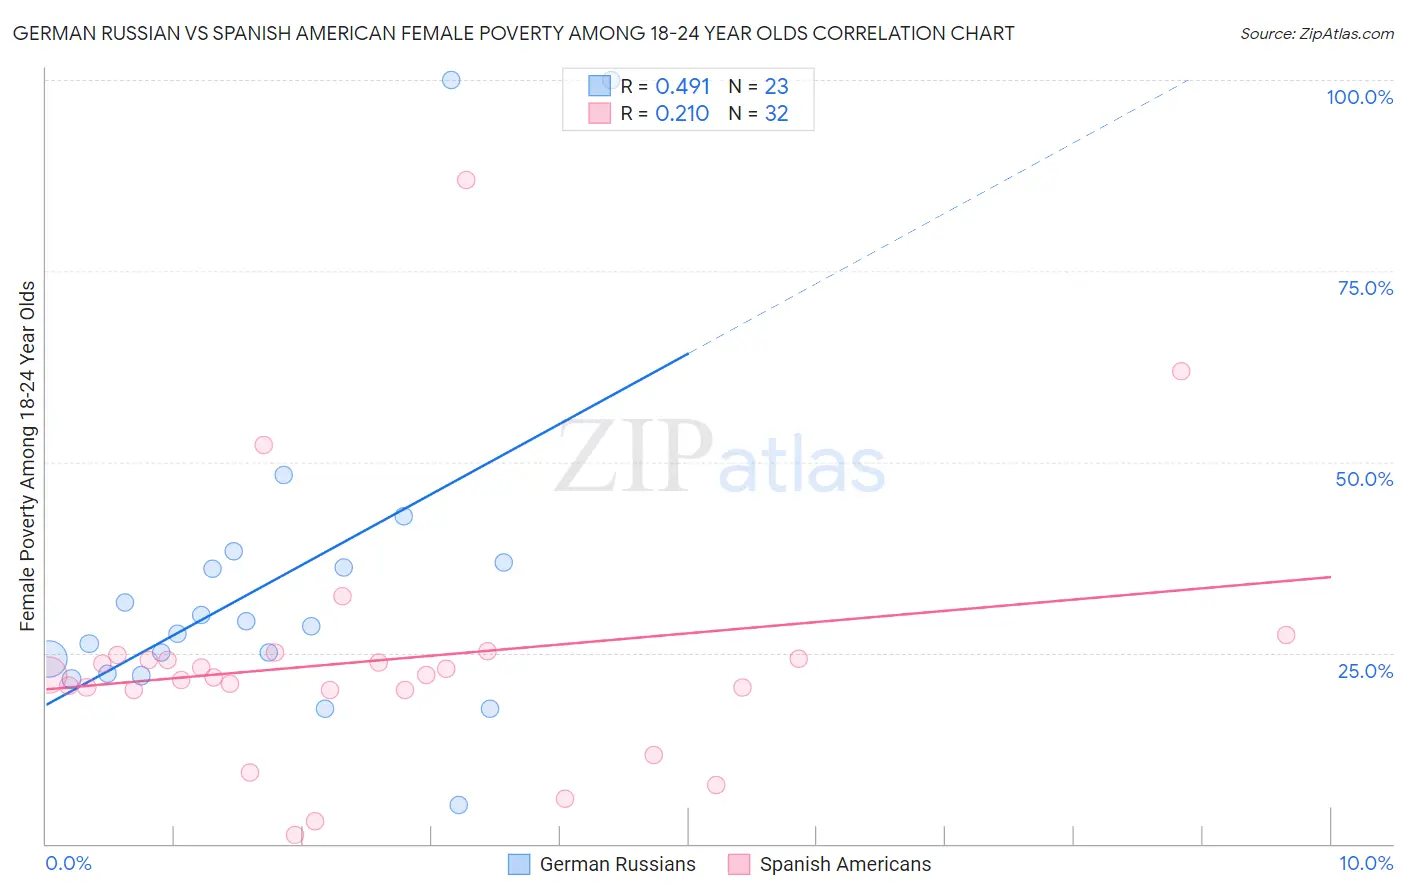
German Russian vs Spanish American Female Poverty Among 18-24 Year Olds Correlation Chart
The statistical analysis conducted on geographies consisting of 95,759,293 people shows a moderate positive correlation between the proportion of German Russians and poverty level among females between the ages 18 and 24 in the United States with a correlation coefficient (R) of 0.491 and weighted average of 25.2%. Similarly, the statistical analysis conducted on geographies consisting of 102,596,848 people shows a weak positive correlation between the proportion of Spanish Americans and poverty level among females between the ages 18 and 24 in the United States with a correlation coefficient (R) of 0.210 and weighted average of 21.9%, a difference of 14.9%.
Female Poverty Among 18-24 Year Olds Correlation Summary
| Measurement | German Russian | Spanish American |
| Minimum | 5.0% | 1.1% |
| Maximum | 100.0% | 87.0% |
| Range | 95.0% | 85.8% |
| Mean | 34.4% | 24.1% |
| Median | 28.4% | 22.1% |
| Interquartile 25% (IQ1) | 22.3% | 20.2% |
| Interquartile 75% (IQ3) | 36.9% | 24.5% |
| Interquartile Range (IQR) | 14.6% | 4.3% |
| Standard Deviation (Sample) | 22.6% | 16.4% |
| Standard Deviation (Population) | 22.1% | 16.1% |
Similar Demographics by Female Poverty Among 18-24 Year Olds
Demographics Similar to German Russians by Female Poverty Among 18-24 Year Olds
In terms of female poverty among 18-24 year olds, the demographic groups most similar to German Russians are Arapaho (25.2%, a difference of 0.030%), Somali (25.1%, a difference of 0.10%), Immigrants from Zaire (25.1%, a difference of 0.40%), Immigrants from Saudi Arabia (25.3%, a difference of 0.43%), and Yakama (25.3%, a difference of 0.68%).
| Demographics | Rating | Rank | Female Poverty Among 18-24 Year Olds |
| Osage | 0.0 /100 | #317 | Tragic 24.5% |
| Chickasaw | 0.0 /100 | #318 | Tragic 24.5% |
| Dutch West Indians | 0.0 /100 | #319 | Tragic 24.5% |
| Immigrants | Congo | 0.0 /100 | #320 | Tragic 24.6% |
| Immigrants | Zaire | 0.0 /100 | #321 | Tragic 25.1% |
| Somalis | 0.0 /100 | #322 | Tragic 25.1% |
| Arapaho | 0.0 /100 | #323 | Tragic 25.2% |
| German Russians | 0.0 /100 | #324 | Tragic 25.2% |
| Immigrants | Saudi Arabia | 0.0 /100 | #325 | Tragic 25.3% |
| Yakama | 0.0 /100 | #326 | Tragic 25.3% |
| Ute | 0.0 /100 | #327 | Tragic 25.4% |
| Natives/Alaskans | 0.0 /100 | #328 | Tragic 25.4% |
| Cajuns | 0.0 /100 | #329 | Tragic 25.7% |
| Immigrants | Somalia | 0.0 /100 | #330 | Tragic 25.7% |
| Chippewa | 0.0 /100 | #331 | Tragic 25.9% |
Demographics Similar to Spanish Americans by Female Poverty Among 18-24 Year Olds
In terms of female poverty among 18-24 year olds, the demographic groups most similar to Spanish Americans are Immigrants from Dominica (21.9%, a difference of 0.010%), Immigrants from Dominican Republic (21.9%, a difference of 0.050%), Bermudan (21.9%, a difference of 0.14%), Yaqui (21.9%, a difference of 0.17%), and Immigrants from Switzerland (21.8%, a difference of 0.43%).
| Demographics | Rating | Rank | Female Poverty Among 18-24 Year Olds |
| Basques | 0.2 /100 | #272 | Tragic 21.7% |
| New Zealanders | 0.2 /100 | #273 | Tragic 21.7% |
| Immigrants | Honduras | 0.1 /100 | #274 | Tragic 21.8% |
| Immigrants | Bangladesh | 0.1 /100 | #275 | Tragic 21.8% |
| Bahamians | 0.1 /100 | #276 | Tragic 21.8% |
| Immigrants | Switzerland | 0.1 /100 | #277 | Tragic 21.8% |
| Yaqui | 0.1 /100 | #278 | Tragic 21.9% |
| Spanish Americans | 0.1 /100 | #279 | Tragic 21.9% |
| Immigrants | Dominica | 0.1 /100 | #280 | Tragic 21.9% |
| Immigrants | Dominican Republic | 0.1 /100 | #281 | Tragic 21.9% |
| Bermudans | 0.1 /100 | #282 | Tragic 21.9% |
| Sub-Saharan Africans | 0.0 /100 | #283 | Tragic 22.0% |
| Tlingit-Haida | 0.0 /100 | #284 | Tragic 22.0% |
| Ottawa | 0.0 /100 | #285 | Tragic 22.0% |
| Ugandans | 0.0 /100 | #286 | Tragic 22.1% |