German Russian vs Colville Single Male Poverty
COMPARE
German Russian
Colville
Single Male Poverty
Single Male Poverty Comparison
German Russians
Colville
13.6%
SINGLE MALE POVERTY
0.8/ 100
METRIC RATING
253rd/ 347
METRIC RANK
18.4%
SINGLE MALE POVERTY
0.0/ 100
METRIC RATING
329th/ 347
METRIC RANK
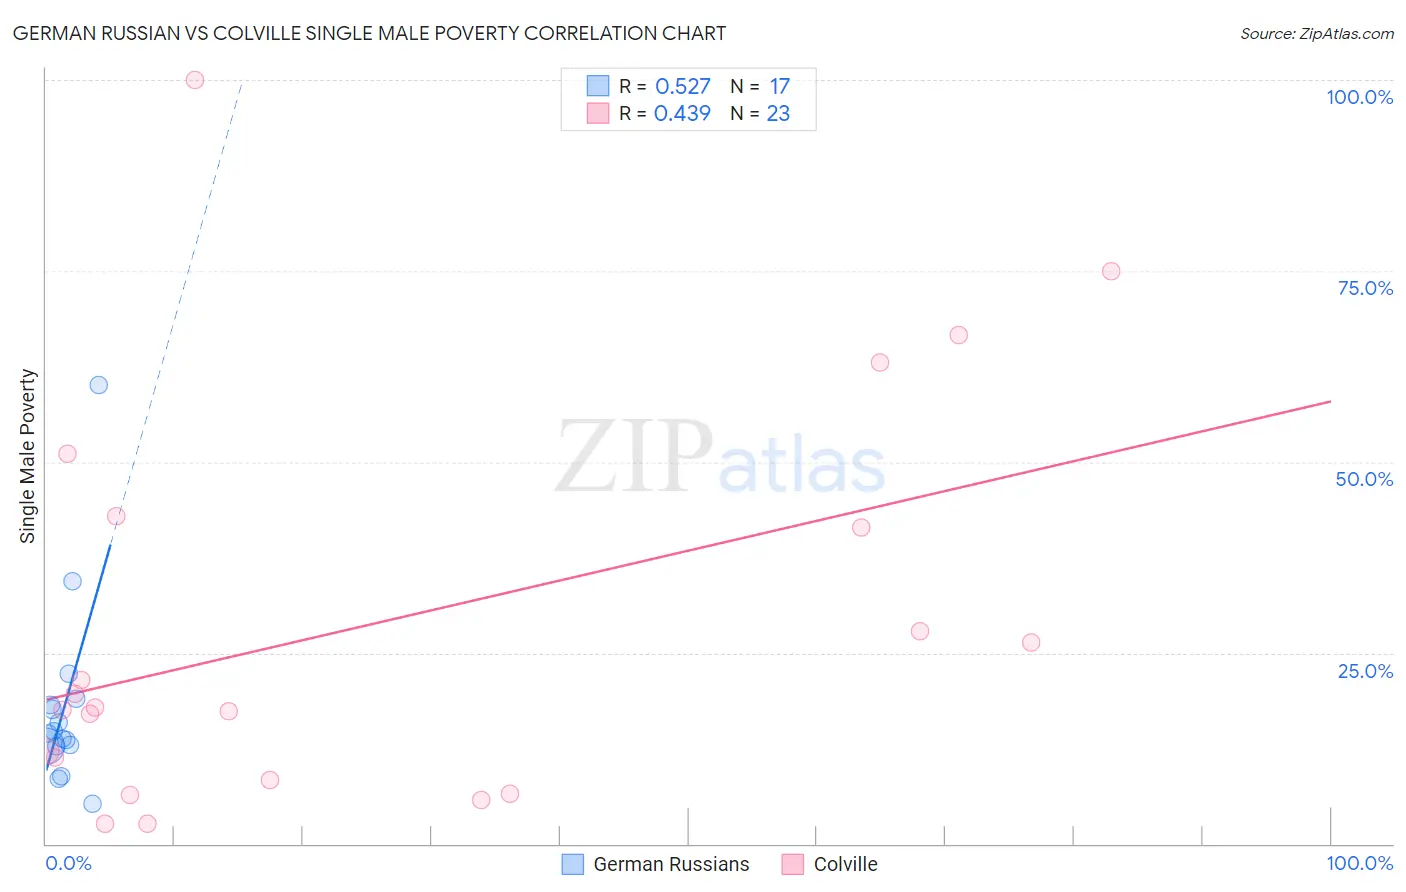
German Russian vs Colville Single Male Poverty Correlation Chart
The statistical analysis conducted on geographies consisting of 92,578,425 people shows a substantial positive correlation between the proportion of German Russians and poverty level among single males in the United States with a correlation coefficient (R) of 0.527 and weighted average of 13.6%. Similarly, the statistical analysis conducted on geographies consisting of 33,707,380 people shows a moderate positive correlation between the proportion of Colville and poverty level among single males in the United States with a correlation coefficient (R) of 0.439 and weighted average of 18.4%, a difference of 35.4%.
Single Male Poverty Correlation Summary
| Measurement | German Russian | Colville |
| Minimum | 5.3% | 2.6% |
| Maximum | 60.0% | 100.0% |
| Range | 54.7% | 97.4% |
| Mean | 17.9% | 28.7% |
| Median | 14.4% | 17.8% |
| Interquartile 25% (IQ1) | 12.8% | 8.3% |
| Interquartile 75% (IQ3) | 18.6% | 42.9% |
| Interquartile Range (IQR) | 5.8% | 34.5% |
| Standard Deviation (Sample) | 12.6% | 26.3% |
| Standard Deviation (Population) | 12.2% | 25.7% |
Similar Demographics by Single Male Poverty
Demographics Similar to German Russians by Single Male Poverty
In terms of single male poverty, the demographic groups most similar to German Russians are Finnish (13.6%, a difference of 0.14%), Immigrants from Zaire (13.6%, a difference of 0.19%), Immigrants from Somalia (13.6%, a difference of 0.30%), Spanish (13.6%, a difference of 0.32%), and Czech (13.5%, a difference of 0.56%).
| Demographics | Rating | Rank | Single Male Poverty |
| Immigrants | Micronesia | 1.2 /100 | #246 | Tragic 13.5% |
| Belgians | 1.2 /100 | #247 | Tragic 13.5% |
| Czechs | 1.2 /100 | #248 | Tragic 13.5% |
| Spanish | 1.0 /100 | #249 | Tragic 13.6% |
| Immigrants | Somalia | 1.0 /100 | #250 | Tragic 13.6% |
| Immigrants | Zaire | 0.9 /100 | #251 | Tragic 13.6% |
| Finns | 0.9 /100 | #252 | Tragic 13.6% |
| German Russians | 0.8 /100 | #253 | Tragic 13.6% |
| Sub-Saharan Africans | 0.5 /100 | #254 | Tragic 13.7% |
| Spaniards | 0.4 /100 | #255 | Tragic 13.7% |
| Immigrants | Belize | 0.4 /100 | #256 | Tragic 13.7% |
| Immigrants | Central America | 0.3 /100 | #257 | Tragic 13.8% |
| Immigrants | Guatemala | 0.3 /100 | #258 | Tragic 13.8% |
| Guatemalans | 0.3 /100 | #259 | Tragic 13.8% |
| Swiss | 0.3 /100 | #260 | Tragic 13.8% |
Demographics Similar to Colville by Single Male Poverty
In terms of single male poverty, the demographic groups most similar to Colville are Kiowa (18.3%, a difference of 0.73%), Cajun (19.1%, a difference of 3.5%), Menominee (17.7%, a difference of 4.0%), Paiute (19.3%, a difference of 4.6%), and Native/Alaskan (19.6%, a difference of 6.4%).
| Demographics | Rating | Rank | Single Male Poverty |
| Shoshone | 0.0 /100 | #322 | Tragic 16.7% |
| Creek | 0.0 /100 | #323 | Tragic 16.8% |
| Immigrants | Yemen | 0.0 /100 | #324 | Tragic 16.9% |
| Choctaw | 0.0 /100 | #325 | Tragic 17.0% |
| Central American Indians | 0.0 /100 | #326 | Tragic 17.2% |
| Menominee | 0.0 /100 | #327 | Tragic 17.7% |
| Kiowa | 0.0 /100 | #328 | Tragic 18.3% |
| Colville | 0.0 /100 | #329 | Tragic 18.4% |
| Cajuns | 0.0 /100 | #330 | Tragic 19.1% |
| Paiute | 0.0 /100 | #331 | Tragic 19.3% |
| Natives/Alaskans | 0.0 /100 | #332 | Tragic 19.6% |
| Inupiat | 0.0 /100 | #333 | Tragic 20.0% |
| Pima | 0.0 /100 | #334 | Tragic 20.2% |
| Yuman | 0.0 /100 | #335 | Tragic 21.3% |
| Tohono O'odham | 0.0 /100 | #336 | Tragic 21.6% |