French vs Immigrants from Dominican Republic 11th Grade
COMPARE
French
Immigrants from Dominican Republic
11th Grade
11th Grade Comparison
French
Immigrants from Dominican Republic
94.1%
11TH GRADE
99.9/ 100
METRIC RATING
50th/ 347
METRIC RANK
86.9%
11TH GRADE
0.0/ 100
METRIC RATING
336th/ 347
METRIC RANK
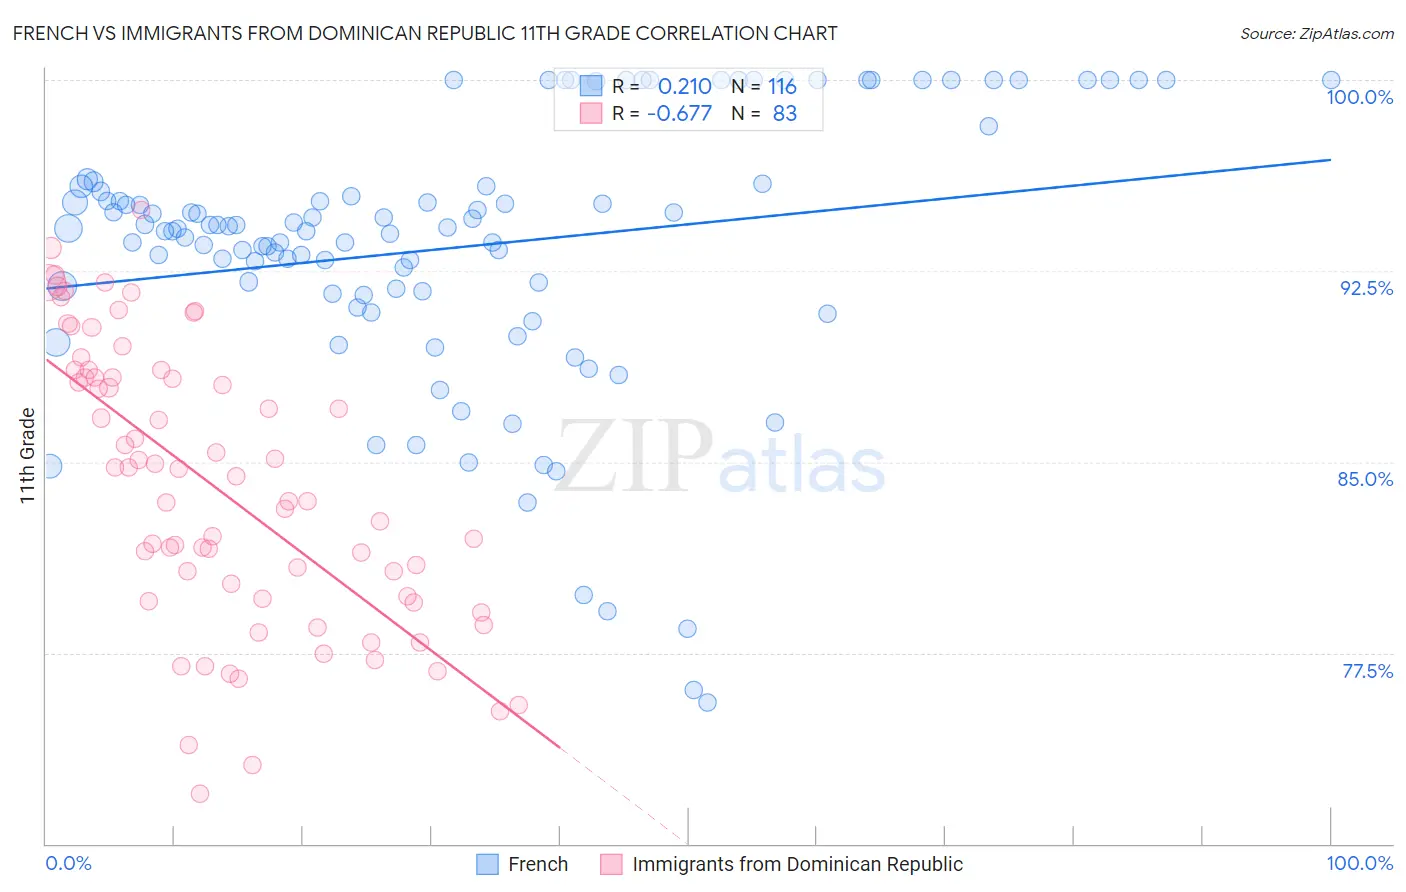
French vs Immigrants from Dominican Republic 11th Grade Correlation Chart
The statistical analysis conducted on geographies consisting of 572,427,471 people shows a weak positive correlation between the proportion of French and percentage of population with at least 11th grade education in the United States with a correlation coefficient (R) of 0.210 and weighted average of 94.1%. Similarly, the statistical analysis conducted on geographies consisting of 275,144,349 people shows a significant negative correlation between the proportion of Immigrants from Dominican Republic and percentage of population with at least 11th grade education in the United States with a correlation coefficient (R) of -0.677 and weighted average of 86.9%, a difference of 8.2%.
11th Grade Correlation Summary
| Measurement | French | Immigrants from Dominican Republic |
| Minimum | 75.6% | 71.9% |
| Maximum | 100.0% | 94.9% |
| Range | 24.4% | 22.9% |
| Mean | 93.4% | 84.0% |
| Median | 94.2% | 84.4% |
| Interquartile 25% (IQ1) | 91.7% | 79.6% |
| Interquartile 75% (IQ3) | 95.8% | 88.3% |
| Interquartile Range (IQR) | 4.1% | 8.7% |
| Standard Deviation (Sample) | 5.3% | 5.5% |
| Standard Deviation (Population) | 5.3% | 5.4% |
Similar Demographics by 11th Grade
Demographics Similar to French by 11th Grade
In terms of 11th grade, the demographic groups most similar to French are Macedonian (94.1%, a difference of 0.0%), Slavic (94.1%, a difference of 0.0%), Filipino (94.1%, a difference of 0.010%), Serbian (94.1%, a difference of 0.020%), and Australian (94.1%, a difference of 0.030%).
| Demographics | Rating | Rank | 11th Grade |
| Greeks | 99.9 /100 | #43 | Exceptional 94.1% |
| Immigrants | Ireland | 99.9 /100 | #44 | Exceptional 94.1% |
| Australians | 99.9 /100 | #45 | Exceptional 94.1% |
| Serbians | 99.9 /100 | #46 | Exceptional 94.1% |
| Filipinos | 99.9 /100 | #47 | Exceptional 94.1% |
| Macedonians | 99.9 /100 | #48 | Exceptional 94.1% |
| Slavs | 99.9 /100 | #49 | Exceptional 94.1% |
| French | 99.9 /100 | #50 | Exceptional 94.1% |
| Turks | 99.9 /100 | #51 | Exceptional 94.0% |
| Immigrants | Canada | 99.9 /100 | #52 | Exceptional 94.0% |
| Immigrants | Australia | 99.9 /100 | #53 | Exceptional 94.0% |
| Immigrants | North America | 99.9 /100 | #54 | Exceptional 94.0% |
| Czechoslovakians | 99.9 /100 | #55 | Exceptional 94.0% |
| French Canadians | 99.9 /100 | #56 | Exceptional 94.0% |
| New Zealanders | 99.9 /100 | #57 | Exceptional 94.0% |
Demographics Similar to Immigrants from Dominican Republic by 11th Grade
In terms of 11th grade, the demographic groups most similar to Immigrants from Dominican Republic are Immigrants from Honduras (86.9%, a difference of 0.0%), Central American (86.9%, a difference of 0.040%), Immigrants from Latin America (86.8%, a difference of 0.12%), Houma (87.0%, a difference of 0.14%), and Immigrants from Yemen (87.1%, a difference of 0.20%).
| Demographics | Rating | Rank | 11th Grade |
| Mexican American Indians | 0.0 /100 | #329 | Tragic 87.5% |
| Hondurans | 0.0 /100 | #330 | Tragic 87.4% |
| Hispanics or Latinos | 0.0 /100 | #331 | Tragic 87.3% |
| Immigrants | Azores | 0.0 /100 | #332 | Tragic 87.2% |
| Immigrants | Yemen | 0.0 /100 | #333 | Tragic 87.1% |
| Houma | 0.0 /100 | #334 | Tragic 87.0% |
| Central Americans | 0.0 /100 | #335 | Tragic 86.9% |
| Immigrants | Dominican Republic | 0.0 /100 | #336 | Tragic 86.9% |
| Immigrants | Honduras | 0.0 /100 | #337 | Tragic 86.9% |
| Immigrants | Latin America | 0.0 /100 | #338 | Tragic 86.8% |
| Guatemalans | 0.0 /100 | #339 | Tragic 86.4% |
| Salvadorans | 0.0 /100 | #340 | Tragic 86.2% |
| Mexicans | 0.0 /100 | #341 | Tragic 86.1% |
| Immigrants | Guatemala | 0.0 /100 | #342 | Tragic 85.8% |
| Immigrants | El Salvador | 0.0 /100 | #343 | Tragic 85.3% |