French Canadian vs Delaware Single Father Poverty
COMPARE
French Canadian
Delaware
Single Father Poverty
Single Father Poverty Comparison
French Canadians
Delaware
18.6%
SINGLE FATHER POVERTY
0.0/ 100
METRIC RATING
307th/ 347
METRIC RANK
18.9%
SINGLE FATHER POVERTY
0.0/ 100
METRIC RATING
314th/ 347
METRIC RANK
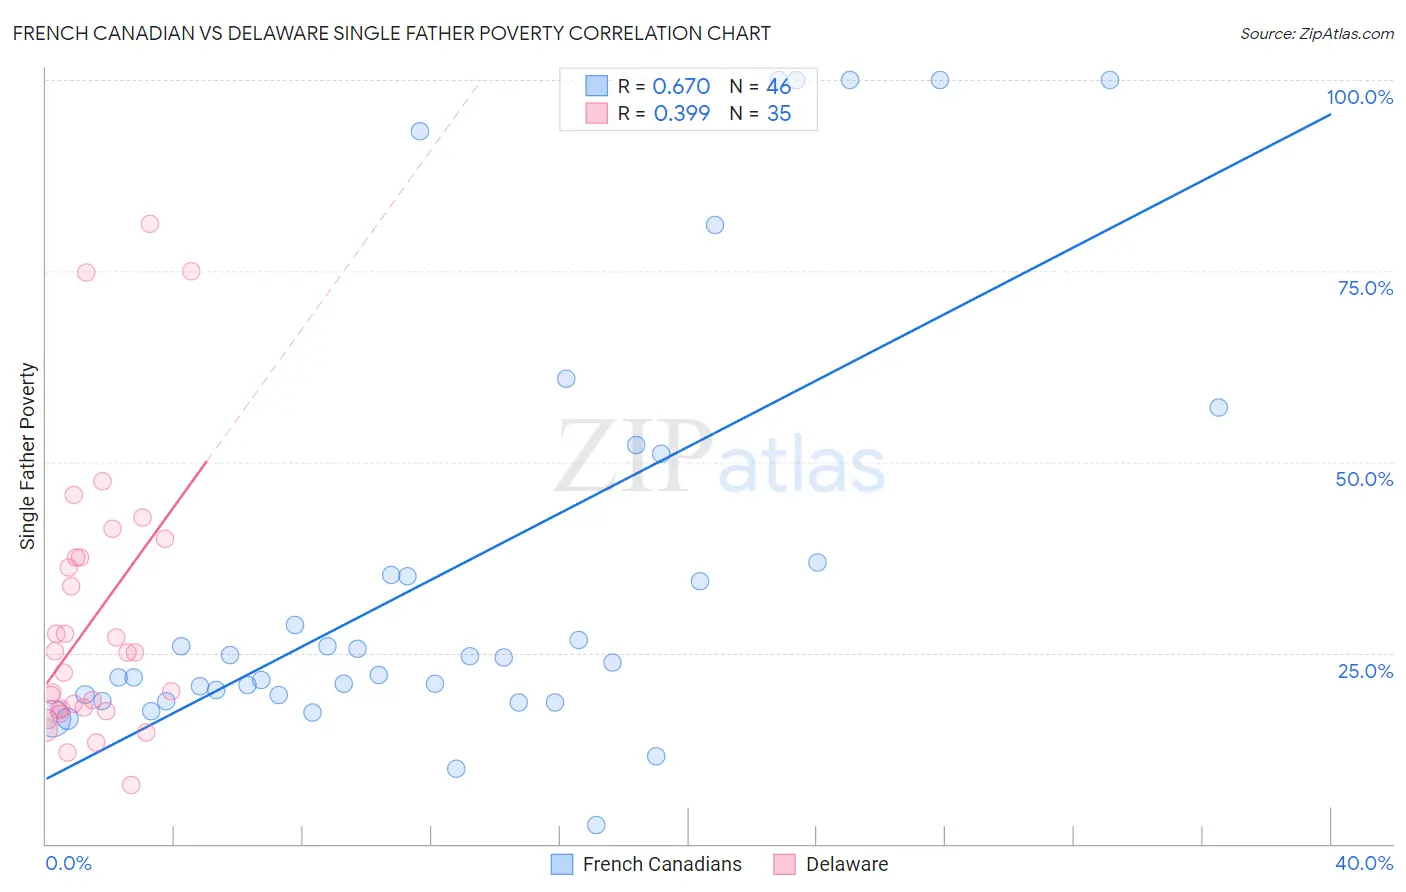
French Canadian vs Delaware Single Father Poverty Correlation Chart
The statistical analysis conducted on geographies consisting of 372,635,885 people shows a significant positive correlation between the proportion of French Canadians and poverty level among single fathers in the United States with a correlation coefficient (R) of 0.670 and weighted average of 18.6%. Similarly, the statistical analysis conducted on geographies consisting of 86,574,131 people shows a mild positive correlation between the proportion of Delaware and poverty level among single fathers in the United States with a correlation coefficient (R) of 0.399 and weighted average of 18.9%, a difference of 1.9%.
Single Father Poverty Correlation Summary
| Measurement | French Canadian | Delaware |
| Minimum | 2.5% | 7.7% |
| Maximum | 100.0% | 81.2% |
| Range | 97.5% | 73.6% |
| Mean | 36.1% | 29.6% |
| Median | 24.1% | 25.0% |
| Interquartile 25% (IQ1) | 19.5% | 17.5% |
| Interquartile 75% (IQ3) | 36.8% | 37.5% |
| Interquartile Range (IQR) | 17.3% | 20.1% |
| Standard Deviation (Sample) | 28.3% | 18.0% |
| Standard Deviation (Population) | 28.0% | 17.7% |
Demographics Similar to French Canadians and Delaware by Single Father Poverty
In terms of single father poverty, the demographic groups most similar to French Canadians are Ottawa (18.6%, a difference of 0.020%), Scotch-Irish (18.6%, a difference of 0.040%), Immigrants from Micronesia (18.6%, a difference of 0.13%), Blackfeet (18.5%, a difference of 0.26%), and Ute (18.5%, a difference of 0.31%). Similarly, the demographic groups most similar to Delaware are Potawatomi (18.9%, a difference of 0.16%), Chickasaw (19.0%, a difference of 0.16%), Immigrants from Dominica (18.9%, a difference of 0.36%), Nonimmigrants (18.8%, a difference of 0.42%), and Osage (19.0%, a difference of 0.56%).
| Demographics | Rating | Rank | Single Father Poverty |
| Immigrants | Dominican Republic | 0.0 /100 | #300 | Tragic 18.4% |
| Hungarians | 0.0 /100 | #301 | Tragic 18.5% |
| Comanche | 0.0 /100 | #302 | Tragic 18.5% |
| Celtics | 0.0 /100 | #303 | Tragic 18.5% |
| Ute | 0.0 /100 | #304 | Tragic 18.5% |
| Blackfeet | 0.0 /100 | #305 | Tragic 18.5% |
| Scotch-Irish | 0.0 /100 | #306 | Tragic 18.6% |
| French Canadians | 0.0 /100 | #307 | Tragic 18.6% |
| Ottawa | 0.0 /100 | #308 | Tragic 18.6% |
| Immigrants | Micronesia | 0.0 /100 | #309 | Tragic 18.6% |
| Chippewa | 0.0 /100 | #310 | Tragic 18.8% |
| Immigrants | Nonimmigrants | 0.0 /100 | #311 | Tragic 18.8% |
| Immigrants | Dominica | 0.0 /100 | #312 | Tragic 18.9% |
| Potawatomi | 0.0 /100 | #313 | Tragic 18.9% |
| Delaware | 0.0 /100 | #314 | Tragic 18.9% |
| Chickasaw | 0.0 /100 | #315 | Tragic 19.0% |
| Osage | 0.0 /100 | #316 | Tragic 19.0% |
| Dominicans | 0.0 /100 | #317 | Tragic 19.1% |
| Dutch West Indians | 0.0 /100 | #318 | Tragic 19.2% |
| Slovaks | 0.0 /100 | #319 | Tragic 19.3% |
| Inupiat | 0.0 /100 | #320 | Tragic 19.5% |