French American Indian vs Danish Poverty
COMPARE
French American Indian
Danish
Poverty
Poverty Comparison
French American Indians
Danes
13.9%
POVERTY
0.5/ 100
METRIC RATING
237th/ 347
METRIC RANK
10.7%
POVERTY
99.5/ 100
METRIC RATING
30th/ 347
METRIC RANK
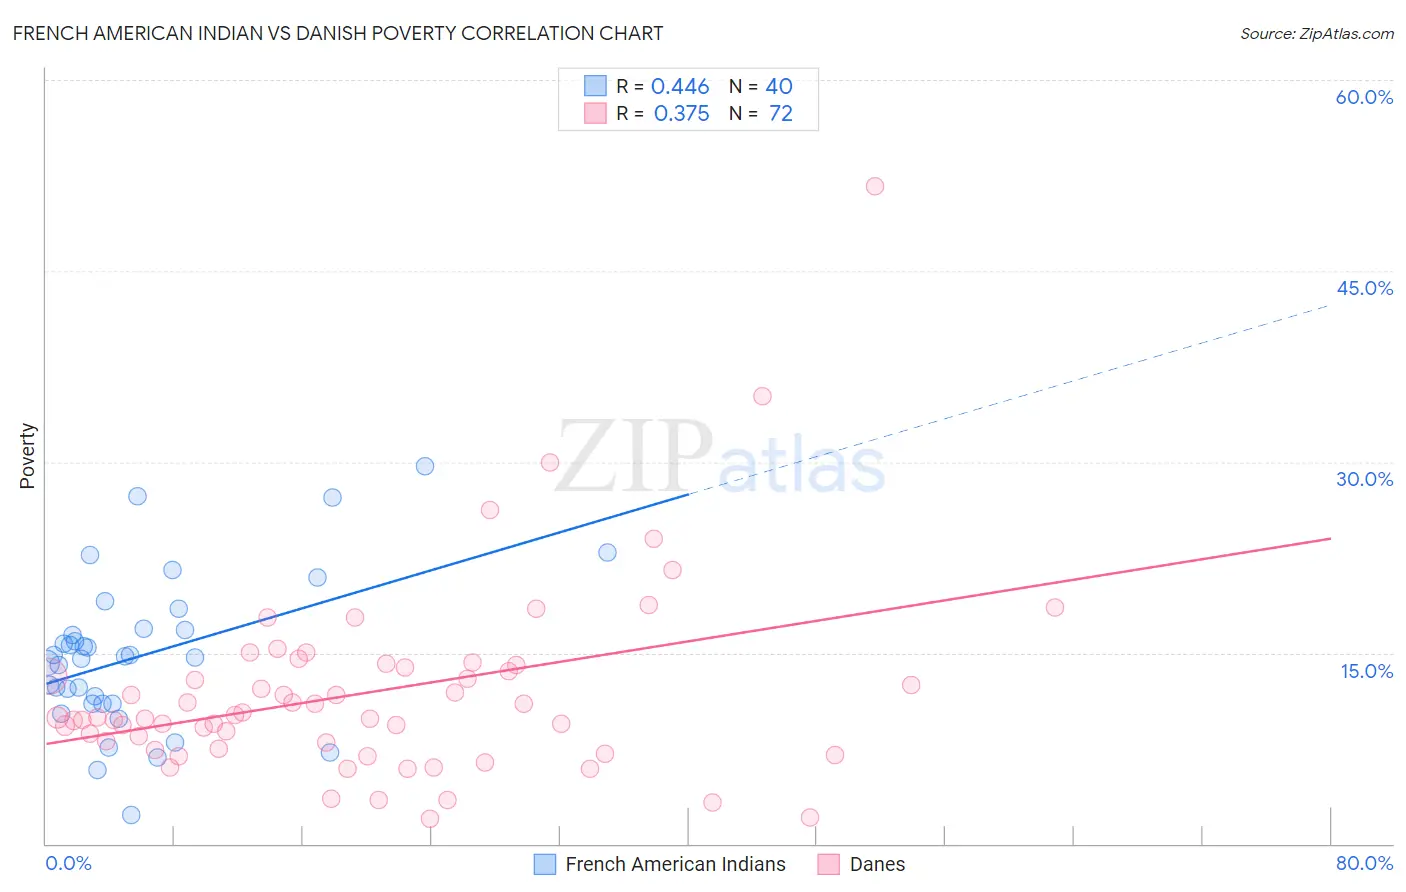
French American Indian vs Danish Poverty Correlation Chart
The statistical analysis conducted on geographies consisting of 131,970,723 people shows a moderate positive correlation between the proportion of French American Indians and poverty level in the United States with a correlation coefficient (R) of 0.446 and weighted average of 13.9%. Similarly, the statistical analysis conducted on geographies consisting of 473,839,079 people shows a mild positive correlation between the proportion of Danes and poverty level in the United States with a correlation coefficient (R) of 0.375 and weighted average of 10.7%, a difference of 29.4%.
Poverty Correlation Summary
| Measurement | French American Indian | Danish |
| Minimum | 2.2% | 1.9% |
| Maximum | 29.6% | 51.6% |
| Range | 27.4% | 49.7% |
| Mean | 14.8% | 11.9% |
| Median | 14.7% | 10.0% |
| Interquartile 25% (IQ1) | 11.0% | 7.7% |
| Interquartile 75% (IQ3) | 16.8% | 13.9% |
| Interquartile Range (IQR) | 5.8% | 6.2% |
| Standard Deviation (Sample) | 5.9% | 7.6% |
| Standard Deviation (Population) | 5.9% | 7.6% |
Similar Demographics by Poverty
Demographics Similar to French American Indians by Poverty
In terms of poverty, the demographic groups most similar to French American Indians are Immigrants from Armenia (13.9%, a difference of 0.020%), Cuban (13.9%, a difference of 0.060%), Ghanaian (13.9%, a difference of 0.13%), Nicaraguan (13.9%, a difference of 0.48%), and Immigrants from Laos (13.8%, a difference of 0.49%).
| Demographics | Rating | Rank | Poverty |
| Alaskan Athabascans | 1.5 /100 | #230 | Tragic 13.6% |
| Nigerians | 1.4 /100 | #231 | Tragic 13.6% |
| Fijians | 0.8 /100 | #232 | Tragic 13.7% |
| Immigrants | Saudi Arabia | 0.8 /100 | #233 | Tragic 13.8% |
| Immigrants | Laos | 0.7 /100 | #234 | Tragic 13.8% |
| Cubans | 0.6 /100 | #235 | Tragic 13.9% |
| Immigrants | Armenia | 0.5 /100 | #236 | Tragic 13.9% |
| French American Indians | 0.5 /100 | #237 | Tragic 13.9% |
| Ghanaians | 0.5 /100 | #238 | Tragic 13.9% |
| Nicaraguans | 0.4 /100 | #239 | Tragic 13.9% |
| Immigrants | Middle Africa | 0.4 /100 | #240 | Tragic 14.0% |
| Salvadorans | 0.4 /100 | #241 | Tragic 14.0% |
| Ecuadorians | 0.4 /100 | #242 | Tragic 14.0% |
| Sudanese | 0.3 /100 | #243 | Tragic 14.0% |
| Nepalese | 0.3 /100 | #244 | Tragic 14.0% |
Demographics Similar to Danes by Poverty
In terms of poverty, the demographic groups most similar to Danes are Greek (10.7%, a difference of 0.010%), Polish (10.7%, a difference of 0.080%), Immigrants from Korea (10.7%, a difference of 0.10%), Immigrants from Northern Europe (10.7%, a difference of 0.17%), and Iranian (10.7%, a difference of 0.17%).
| Demographics | Rating | Rank | Poverty |
| Swedes | 99.7 /100 | #23 | Exceptional 10.6% |
| Italians | 99.7 /100 | #24 | Exceptional 10.6% |
| Croatians | 99.6 /100 | #25 | Exceptional 10.6% |
| Burmese | 99.6 /100 | #26 | Exceptional 10.7% |
| Immigrants | Northern Europe | 99.6 /100 | #27 | Exceptional 10.7% |
| Immigrants | Korea | 99.5 /100 | #28 | Exceptional 10.7% |
| Greeks | 99.5 /100 | #29 | Exceptional 10.7% |
| Danes | 99.5 /100 | #30 | Exceptional 10.7% |
| Poles | 99.5 /100 | #31 | Exceptional 10.7% |
| Iranians | 99.5 /100 | #32 | Exceptional 10.7% |
| Macedonians | 99.4 /100 | #33 | Exceptional 10.8% |
| Immigrants | Poland | 99.4 /100 | #34 | Exceptional 10.8% |
| Tongans | 99.4 /100 | #35 | Exceptional 10.8% |
| Cypriots | 99.3 /100 | #36 | Exceptional 10.8% |
| Immigrants | Greece | 99.3 /100 | #37 | Exceptional 10.8% |