Finnish vs Palestinian Child Poverty Under the Age of 16
COMPARE
Finnish
Palestinian
Child Poverty Under the Age of 16
Child Poverty Under the Age of 16 Comparison
Finns
Palestinians
14.5%
CHILD POVERTY UNDER THE AGE OF 16
97.2/ 100
METRIC RATING
81st/ 347
METRIC RANK
15.1%
CHILD POVERTY UNDER THE AGE OF 16
90.9/ 100
METRIC RATING
125th/ 347
METRIC RANK
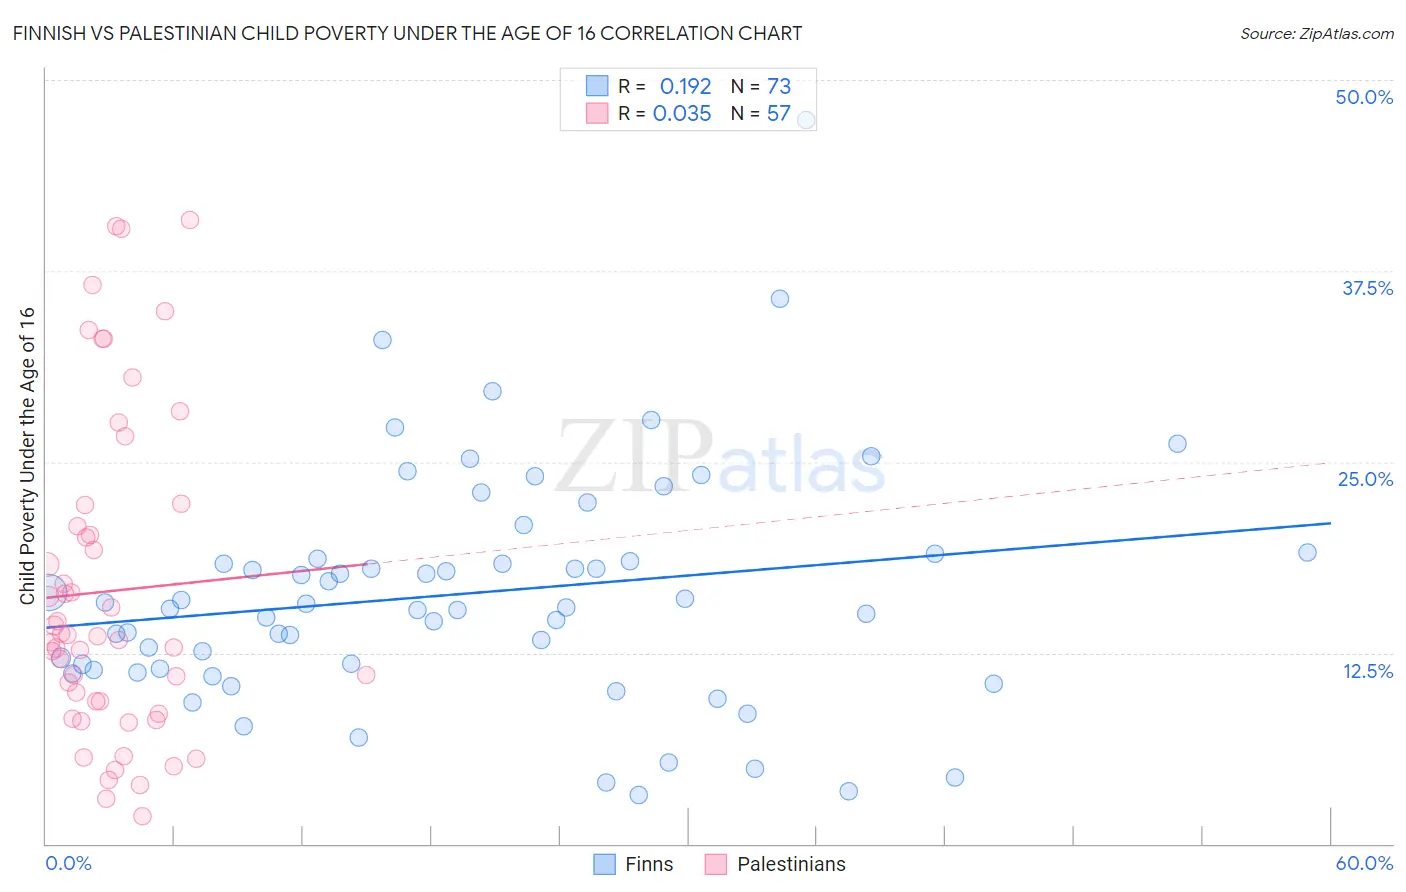
Finnish vs Palestinian Child Poverty Under the Age of 16 Correlation Chart
The statistical analysis conducted on geographies consisting of 399,880,934 people shows a poor positive correlation between the proportion of Finns and poverty level among children under the age of 16 in the United States with a correlation coefficient (R) of 0.192 and weighted average of 14.5%. Similarly, the statistical analysis conducted on geographies consisting of 215,678,574 people shows no correlation between the proportion of Palestinians and poverty level among children under the age of 16 in the United States with a correlation coefficient (R) of 0.035 and weighted average of 15.1%, a difference of 4.2%.
Child Poverty Under the Age of 16 Correlation Summary
| Measurement | Finnish | Palestinian |
| Minimum | 3.2% | 1.8% |
| Maximum | 47.4% | 40.9% |
| Range | 44.1% | 39.1% |
| Mean | 16.4% | 16.5% |
| Median | 15.4% | 13.6% |
| Interquartile 25% (IQ1) | 11.4% | 8.9% |
| Interquartile 75% (IQ3) | 18.8% | 21.5% |
| Interquartile Range (IQR) | 7.4% | 12.5% |
| Standard Deviation (Sample) | 7.7% | 10.4% |
| Standard Deviation (Population) | 7.7% | 10.3% |
Similar Demographics by Child Poverty Under the Age of 16
Demographics Similar to Finns by Child Poverty Under the Age of 16
In terms of child poverty under the age of 16, the demographic groups most similar to Finns are Immigrants from North Macedonia (14.5%, a difference of 0.030%), Immigrants from Canada (14.5%, a difference of 0.030%), Egyptian (14.5%, a difference of 0.060%), Immigrants from Latvia (14.5%, a difference of 0.080%), and Swiss (14.5%, a difference of 0.10%).
| Demographics | Rating | Rank | Child Poverty Under the Age of 16 |
| Macedonians | 97.6 /100 | #74 | Exceptional 14.4% |
| Ukrainians | 97.5 /100 | #75 | Exceptional 14.4% |
| Immigrants | Eastern Europe | 97.5 /100 | #76 | Exceptional 14.4% |
| Australians | 97.5 /100 | #77 | Exceptional 14.4% |
| Immigrants | Russia | 97.3 /100 | #78 | Exceptional 14.5% |
| Swiss | 97.3 /100 | #79 | Exceptional 14.5% |
| Immigrants | North Macedonia | 97.2 /100 | #80 | Exceptional 14.5% |
| Finns | 97.2 /100 | #81 | Exceptional 14.5% |
| Immigrants | Canada | 97.2 /100 | #82 | Exceptional 14.5% |
| Egyptians | 97.2 /100 | #83 | Exceptional 14.5% |
| Immigrants | Latvia | 97.1 /100 | #84 | Exceptional 14.5% |
| Soviet Union | 97.1 /100 | #85 | Exceptional 14.5% |
| Immigrants | Argentina | 97.1 /100 | #86 | Exceptional 14.5% |
| Taiwanese | 97.1 /100 | #87 | Exceptional 14.5% |
| Northern Europeans | 97.0 /100 | #88 | Exceptional 14.5% |
Demographics Similar to Palestinians by Child Poverty Under the Age of 16
In terms of child poverty under the age of 16, the demographic groups most similar to Palestinians are Immigrants from Brazil (15.1%, a difference of 0.040%), Czechoslovakian (15.1%, a difference of 0.040%), Portuguese (15.1%, a difference of 0.14%), Immigrants from Western Europe (15.1%, a difference of 0.23%), and Pakistani (15.0%, a difference of 0.29%).
| Demographics | Rating | Rank | Child Poverty Under the Age of 16 |
| Immigrants | Malaysia | 92.6 /100 | #118 | Exceptional 15.0% |
| Scottish | 92.3 /100 | #119 | Exceptional 15.0% |
| South Africans | 92.1 /100 | #120 | Exceptional 15.0% |
| Immigrants | Zimbabwe | 92.1 /100 | #121 | Exceptional 15.0% |
| Pakistanis | 91.7 /100 | #122 | Exceptional 15.0% |
| Immigrants | Brazil | 91.1 /100 | #123 | Exceptional 15.1% |
| Czechoslovakians | 91.0 /100 | #124 | Exceptional 15.1% |
| Palestinians | 90.9 /100 | #125 | Exceptional 15.1% |
| Portuguese | 90.6 /100 | #126 | Exceptional 15.1% |
| Immigrants | Western Europe | 90.3 /100 | #127 | Exceptional 15.1% |
| Immigrants | Kazakhstan | 90.2 /100 | #128 | Exceptional 15.1% |
| Immigrants | Southern Europe | 89.7 /100 | #129 | Excellent 15.1% |
| Mongolians | 89.5 /100 | #130 | Excellent 15.2% |
| Armenians | 89.4 /100 | #131 | Excellent 15.2% |
| Canadians | 89.1 /100 | #132 | Excellent 15.2% |