Immigrants from Norway vs African Single Father Poverty
COMPARE
Immigrants from Norway
African
Single Father Poverty
Single Father Poverty Comparison
Immigrants from Norway
Africans
16.8%
SINGLE FATHER POVERTY
6.5/ 100
METRIC RATING
224th/ 347
METRIC RANK
18.3%
SINGLE FATHER POVERTY
0.0/ 100
METRIC RATING
298th/ 347
METRIC RANK
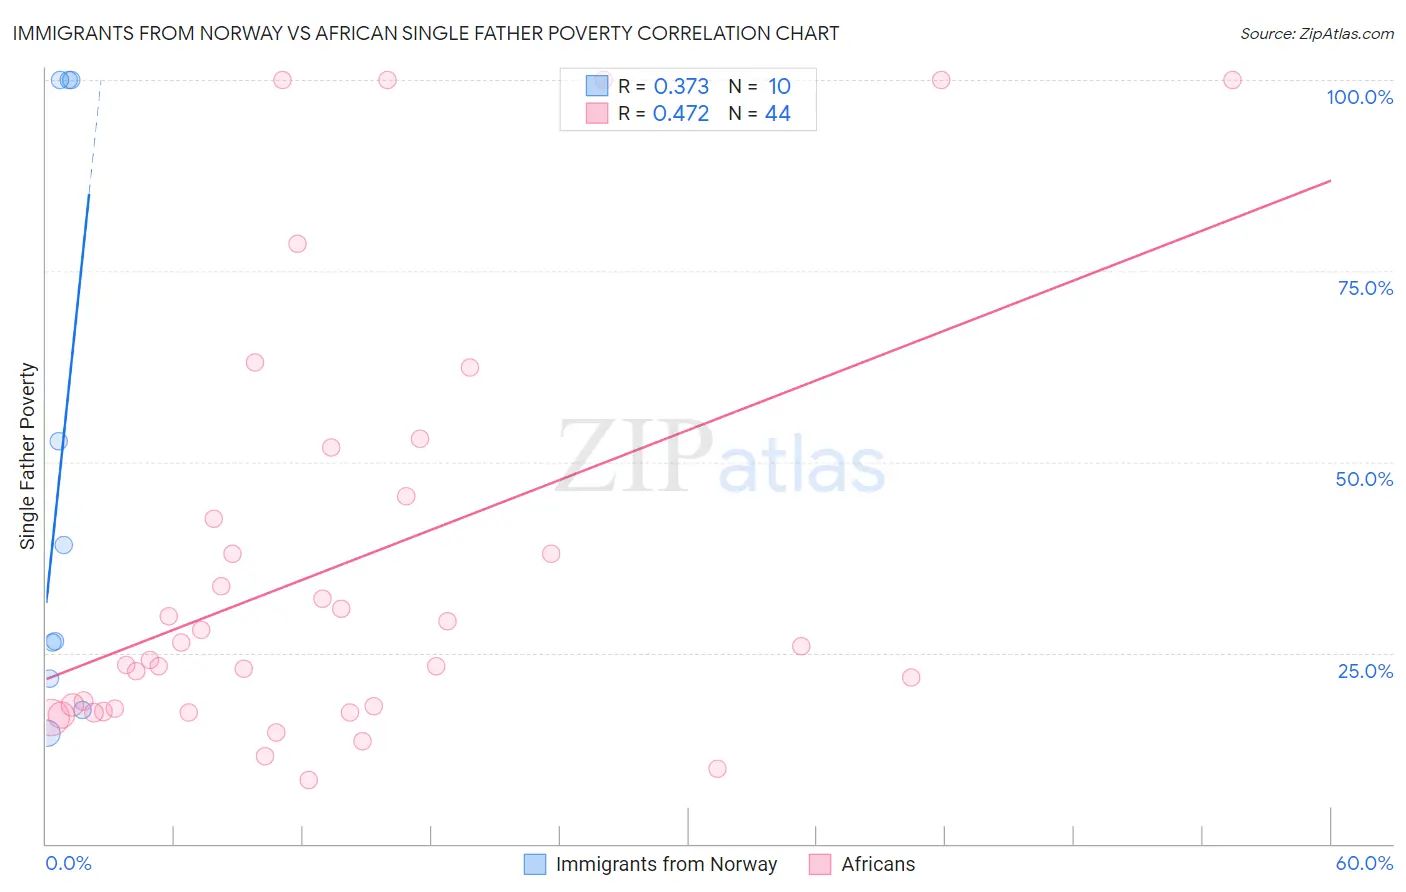
Immigrants from Norway vs African Single Father Poverty Correlation Chart
The statistical analysis conducted on geographies consisting of 101,345,089 people shows a mild positive correlation between the proportion of Immigrants from Norway and poverty level among single fathers in the United States with a correlation coefficient (R) of 0.373 and weighted average of 16.8%. Similarly, the statistical analysis conducted on geographies consisting of 369,651,911 people shows a moderate positive correlation between the proportion of Africans and poverty level among single fathers in the United States with a correlation coefficient (R) of 0.472 and weighted average of 18.3%, a difference of 9.2%.
Single Father Poverty Correlation Summary
| Measurement | Immigrants from Norway | African |
| Minimum | 14.5% | 8.3% |
| Maximum | 100.0% | 100.0% |
| Range | 85.5% | 91.7% |
| Mean | 49.8% | 36.4% |
| Median | 32.8% | 25.0% |
| Interquartile 25% (IQ1) | 21.6% | 17.5% |
| Interquartile 75% (IQ3) | 100.0% | 44.0% |
| Interquartile Range (IQR) | 78.4% | 26.5% |
| Standard Deviation (Sample) | 36.3% | 27.5% |
| Standard Deviation (Population) | 34.4% | 27.1% |
Similar Demographics by Single Father Poverty
Demographics Similar to Immigrants from Norway by Single Father Poverty
In terms of single father poverty, the demographic groups most similar to Immigrants from Norway are Menominee (16.8%, a difference of 0.020%), Hispanic or Latino (16.8%, a difference of 0.070%), Immigrants from Austria (16.8%, a difference of 0.080%), British (16.8%, a difference of 0.16%), and Belgian (16.8%, a difference of 0.23%).
| Demographics | Rating | Rank | Single Father Poverty |
| Cheyenne | 9.3 /100 | #217 | Tragic 16.7% |
| Immigrants | Uganda | 8.6 /100 | #218 | Tragic 16.7% |
| Immigrants | Ghana | 8.1 /100 | #219 | Tragic 16.7% |
| Immigrants | Denmark | 8.1 /100 | #220 | Tragic 16.7% |
| Immigrants | Greece | 8.1 /100 | #221 | Tragic 16.7% |
| Immigrants | Spain | 8.0 /100 | #222 | Tragic 16.7% |
| Immigrants | Austria | 7.0 /100 | #223 | Tragic 16.8% |
| Immigrants | Norway | 6.5 /100 | #224 | Tragic 16.8% |
| Menominee | 6.4 /100 | #225 | Tragic 16.8% |
| Hispanics or Latinos | 6.1 /100 | #226 | Tragic 16.8% |
| British | 5.6 /100 | #227 | Tragic 16.8% |
| Belgians | 5.3 /100 | #228 | Tragic 16.8% |
| Israelis | 4.6 /100 | #229 | Tragic 16.8% |
| Immigrants | Trinidad and Tobago | 4.5 /100 | #230 | Tragic 16.8% |
| Spanish Americans | 3.7 /100 | #231 | Tragic 16.9% |
Demographics Similar to Africans by Single Father Poverty
In terms of single father poverty, the demographic groups most similar to Africans are White/Caucasian (18.4%, a difference of 0.21%), Immigrants from Dominican Republic (18.4%, a difference of 0.53%), French (18.2%, a difference of 0.75%), Hungarian (18.5%, a difference of 0.75%), and Comanche (18.5%, a difference of 0.86%).
| Demographics | Rating | Rank | Single Father Poverty |
| Alaskan Athabascans | 0.0 /100 | #291 | Tragic 18.1% |
| Immigrants | Bahamas | 0.0 /100 | #292 | Tragic 18.1% |
| Alaska Natives | 0.0 /100 | #293 | Tragic 18.1% |
| U.S. Virgin Islanders | 0.0 /100 | #294 | Tragic 18.1% |
| Yakama | 0.0 /100 | #295 | Tragic 18.1% |
| Seminole | 0.0 /100 | #296 | Tragic 18.1% |
| French | 0.0 /100 | #297 | Tragic 18.2% |
| Africans | 0.0 /100 | #298 | Tragic 18.3% |
| Whites/Caucasians | 0.0 /100 | #299 | Tragic 18.4% |
| Immigrants | Dominican Republic | 0.0 /100 | #300 | Tragic 18.4% |
| Hungarians | 0.0 /100 | #301 | Tragic 18.5% |
| Comanche | 0.0 /100 | #302 | Tragic 18.5% |
| Celtics | 0.0 /100 | #303 | Tragic 18.5% |
| Ute | 0.0 /100 | #304 | Tragic 18.5% |
| Blackfeet | 0.0 /100 | #305 | Tragic 18.5% |