Filipino vs Spanish Child Poverty Among Boys Under 16
COMPARE
Filipino
Spanish
Child Poverty Among Boys Under 16
Child Poverty Among Boys Under 16 Comparison
Filipinos
Spanish
11.1%
CHILD POVERTY AMONG BOYS UNDER 16
100.0/ 100
METRIC RATING
3rd/ 347
METRIC RANK
17.0%
CHILD POVERTY AMONG BOYS UNDER 16
20.8/ 100
METRIC RATING
195th/ 347
METRIC RANK
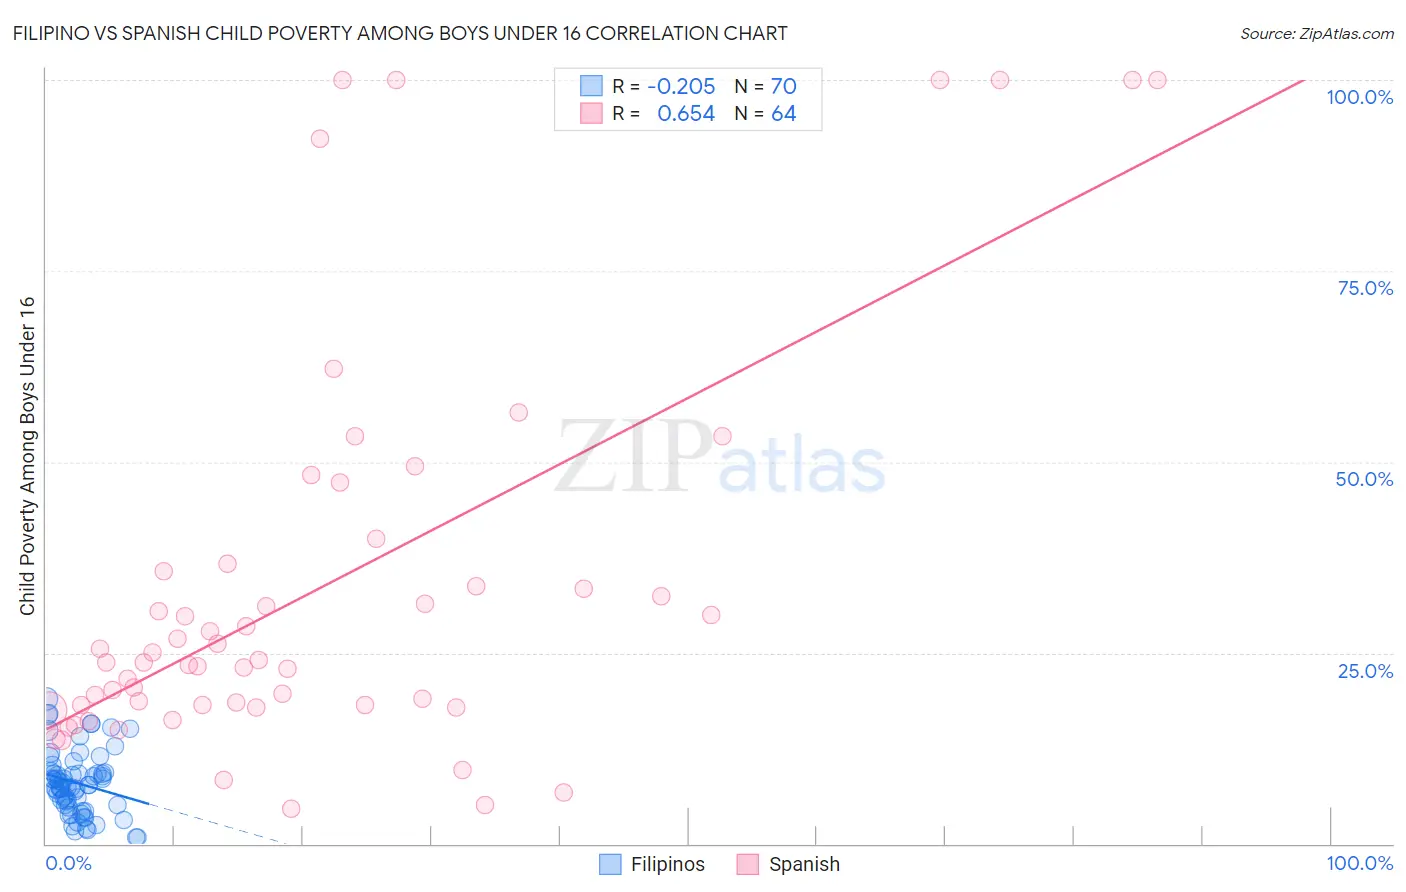
Filipino vs Spanish Child Poverty Among Boys Under 16 Correlation Chart
The statistical analysis conducted on geographies consisting of 250,988,571 people shows a weak negative correlation between the proportion of Filipinos and poverty level among boys under the age of 16 in the United States with a correlation coefficient (R) of -0.205 and weighted average of 11.1%. Similarly, the statistical analysis conducted on geographies consisting of 415,463,522 people shows a significant positive correlation between the proportion of Spanish and poverty level among boys under the age of 16 in the United States with a correlation coefficient (R) of 0.654 and weighted average of 17.0%, a difference of 53.4%.
Child Poverty Among Boys Under 16 Correlation Summary
| Measurement | Filipino | Spanish |
| Minimum | 0.83% | 4.6% |
| Maximum | 19.0% | 100.0% |
| Range | 18.1% | 95.4% |
| Mean | 7.9% | 33.7% |
| Median | 7.5% | 23.9% |
| Interquartile 25% (IQ1) | 5.1% | 18.2% |
| Interquartile 75% (IQ3) | 9.4% | 36.2% |
| Interquartile Range (IQR) | 4.3% | 18.0% |
| Standard Deviation (Sample) | 4.2% | 26.1% |
| Standard Deviation (Population) | 4.1% | 25.9% |
Similar Demographics by Child Poverty Among Boys Under 16
Demographics Similar to Filipinos by Child Poverty Among Boys Under 16
In terms of child poverty among boys under 16, the demographic groups most similar to Filipinos are Immigrants from Taiwan (11.0%, a difference of 0.78%), Immigrants from India (10.9%, a difference of 2.3%), Thai (11.7%, a difference of 5.1%), Chinese (11.9%, a difference of 6.8%), and Immigrants from Hong Kong (12.3%, a difference of 10.2%).
| Demographics | Rating | Rank | Child Poverty Among Boys Under 16 |
| Immigrants | India | 100.0 /100 | #1 | Exceptional 10.9% |
| Immigrants | Taiwan | 100.0 /100 | #2 | Exceptional 11.0% |
| Filipinos | 100.0 /100 | #3 | Exceptional 11.1% |
| Thais | 100.0 /100 | #4 | Exceptional 11.7% |
| Chinese | 100.0 /100 | #5 | Exceptional 11.9% |
| Immigrants | Hong Kong | 100.0 /100 | #6 | Exceptional 12.3% |
| Iranians | 100.0 /100 | #7 | Exceptional 12.4% |
| Immigrants | Singapore | 100.0 /100 | #8 | Exceptional 12.5% |
| Immigrants | Iran | 100.0 /100 | #9 | Exceptional 12.5% |
| Bhutanese | 100.0 /100 | #10 | Exceptional 12.6% |
| Immigrants | South Central Asia | 100.0 /100 | #11 | Exceptional 12.7% |
| Burmese | 99.9 /100 | #12 | Exceptional 13.0% |
| Immigrants | Korea | 99.9 /100 | #13 | Exceptional 13.0% |
| Immigrants | Ireland | 99.9 /100 | #14 | Exceptional 13.1% |
| Immigrants | Japan | 99.9 /100 | #15 | Exceptional 13.1% |
Demographics Similar to Spanish by Child Poverty Among Boys Under 16
In terms of child poverty among boys under 16, the demographic groups most similar to Spanish are Spaniard (17.1%, a difference of 0.040%), Immigrants from Lebanon (17.0%, a difference of 0.070%), Immigrants from Kenya (17.1%, a difference of 0.11%), Immigrants from Uganda (17.0%, a difference of 0.14%), and Immigrants from Iraq (17.0%, a difference of 0.14%).
| Demographics | Rating | Rank | Child Poverty Among Boys Under 16 |
| Immigrants | South America | 37.7 /100 | #188 | Fair 16.7% |
| Immigrants | Morocco | 34.5 /100 | #189 | Fair 16.7% |
| Arabs | 31.1 /100 | #190 | Fair 16.8% |
| Alaska Natives | 29.8 /100 | #191 | Fair 16.8% |
| Immigrants | Uganda | 21.6 /100 | #192 | Fair 17.0% |
| Immigrants | Iraq | 21.6 /100 | #193 | Fair 17.0% |
| Immigrants | Lebanon | 21.2 /100 | #194 | Fair 17.0% |
| Spanish | 20.8 /100 | #195 | Fair 17.0% |
| Spaniards | 20.5 /100 | #196 | Fair 17.1% |
| Immigrants | Kenya | 20.1 /100 | #197 | Fair 17.1% |
| Immigrants | Cameroon | 19.0 /100 | #198 | Poor 17.1% |
| Delaware | 18.8 /100 | #199 | Poor 17.1% |
| Immigrants | Uruguay | 16.9 /100 | #200 | Poor 17.2% |
| Immigrants | Afghanistan | 13.7 /100 | #201 | Poor 17.3% |
| Immigrants | Sierra Leone | 13.4 /100 | #202 | Poor 17.3% |