Filipino vs Immigrants from South Central Asia Child Poverty Among Boys Under 16
COMPARE
Filipino
Immigrants from South Central Asia
Child Poverty Among Boys Under 16
Child Poverty Among Boys Under 16 Comparison
Filipinos
Immigrants from South Central Asia
11.1%
CHILD POVERTY AMONG BOYS UNDER 16
100.0/ 100
METRIC RATING
3rd/ 347
METRIC RANK
12.7%
CHILD POVERTY AMONG BOYS UNDER 16
100.0/ 100
METRIC RATING
11th/ 347
METRIC RANK
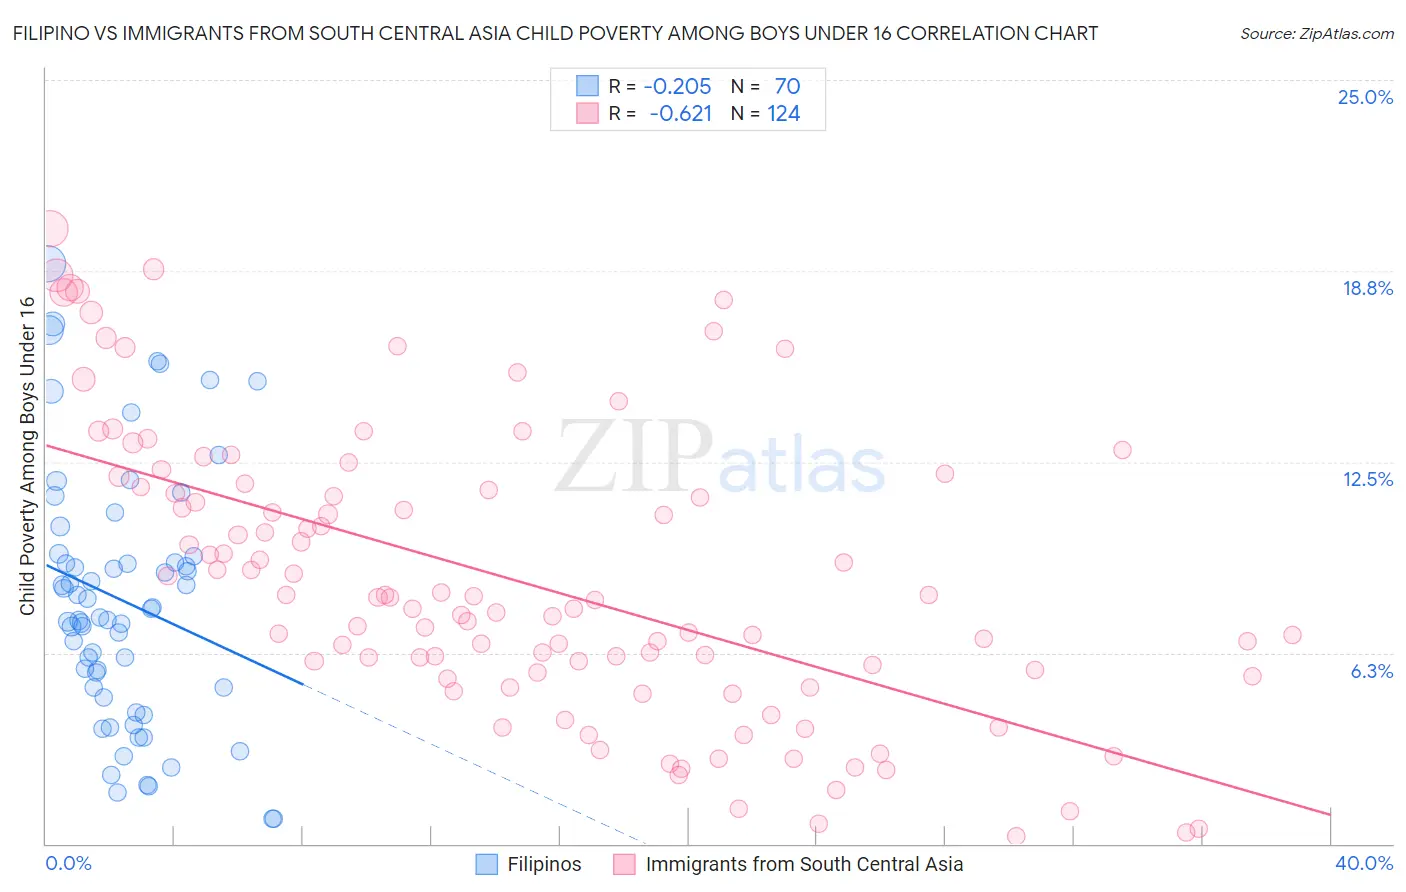
Filipino vs Immigrants from South Central Asia Child Poverty Among Boys Under 16 Correlation Chart
The statistical analysis conducted on geographies consisting of 250,988,571 people shows a weak negative correlation between the proportion of Filipinos and poverty level among boys under the age of 16 in the United States with a correlation coefficient (R) of -0.205 and weighted average of 11.1%. Similarly, the statistical analysis conducted on geographies consisting of 462,302,909 people shows a significant negative correlation between the proportion of Immigrants from South Central Asia and poverty level among boys under the age of 16 in the United States with a correlation coefficient (R) of -0.621 and weighted average of 12.7%, a difference of 13.9%.
Child Poverty Among Boys Under 16 Correlation Summary
| Measurement | Filipino | Immigrants from South Central Asia |
| Minimum | 0.83% | 0.23% |
| Maximum | 19.0% | 20.2% |
| Range | 18.1% | 19.9% |
| Mean | 7.9% | 8.6% |
| Median | 7.5% | 8.0% |
| Interquartile 25% (IQ1) | 5.1% | 5.5% |
| Interquartile 75% (IQ3) | 9.4% | 11.6% |
| Interquartile Range (IQR) | 4.3% | 6.1% |
| Standard Deviation (Sample) | 4.2% | 4.7% |
| Standard Deviation (Population) | 4.1% | 4.7% |
Demographics Similar to Filipinos and Immigrants from South Central Asia by Child Poverty Among Boys Under 16
In terms of child poverty among boys under 16, the demographic groups most similar to Filipinos are Immigrants from Taiwan (11.0%, a difference of 0.78%), Immigrants from India (10.9%, a difference of 2.3%), Thai (11.7%, a difference of 5.1%), Chinese (11.9%, a difference of 6.8%), and Immigrants from Hong Kong (12.3%, a difference of 10.2%). Similarly, the demographic groups most similar to Immigrants from South Central Asia are Bhutanese (12.6%, a difference of 0.52%), Immigrants from Iran (12.5%, a difference of 0.88%), Immigrants from Singapore (12.5%, a difference of 1.4%), Iranian (12.4%, a difference of 1.7%), and Burmese (13.0%, a difference of 2.4%).
| Demographics | Rating | Rank | Child Poverty Among Boys Under 16 |
| Immigrants | India | 100.0 /100 | #1 | Exceptional 10.9% |
| Immigrants | Taiwan | 100.0 /100 | #2 | Exceptional 11.0% |
| Filipinos | 100.0 /100 | #3 | Exceptional 11.1% |
| Thais | 100.0 /100 | #4 | Exceptional 11.7% |
| Chinese | 100.0 /100 | #5 | Exceptional 11.9% |
| Immigrants | Hong Kong | 100.0 /100 | #6 | Exceptional 12.3% |
| Iranians | 100.0 /100 | #7 | Exceptional 12.4% |
| Immigrants | Singapore | 100.0 /100 | #8 | Exceptional 12.5% |
| Immigrants | Iran | 100.0 /100 | #9 | Exceptional 12.5% |
| Bhutanese | 100.0 /100 | #10 | Exceptional 12.6% |
| Immigrants | South Central Asia | 100.0 /100 | #11 | Exceptional 12.7% |
| Burmese | 99.9 /100 | #12 | Exceptional 13.0% |
| Immigrants | Korea | 99.9 /100 | #13 | Exceptional 13.0% |
| Immigrants | Ireland | 99.9 /100 | #14 | Exceptional 13.1% |
| Immigrants | Japan | 99.9 /100 | #15 | Exceptional 13.1% |
| Maltese | 99.9 /100 | #16 | Exceptional 13.2% |
| Norwegians | 99.9 /100 | #17 | Exceptional 13.2% |
| Bulgarians | 99.9 /100 | #18 | Exceptional 13.3% |
| Bolivians | 99.9 /100 | #19 | Exceptional 13.3% |
| Indians (Asian) | 99.9 /100 | #20 | Exceptional 13.3% |