Filipino vs Immigrants from Hong Kong 7th Grade
COMPARE
Filipino
Immigrants from Hong Kong
7th Grade
7th Grade Comparison
Filipinos
Immigrants from Hong Kong
96.4%
7TH GRADE
92.1/ 100
METRIC RATING
131st/ 347
METRIC RANK
95.2%
7TH GRADE
0.3/ 100
METRIC RATING
268th/ 347
METRIC RANK
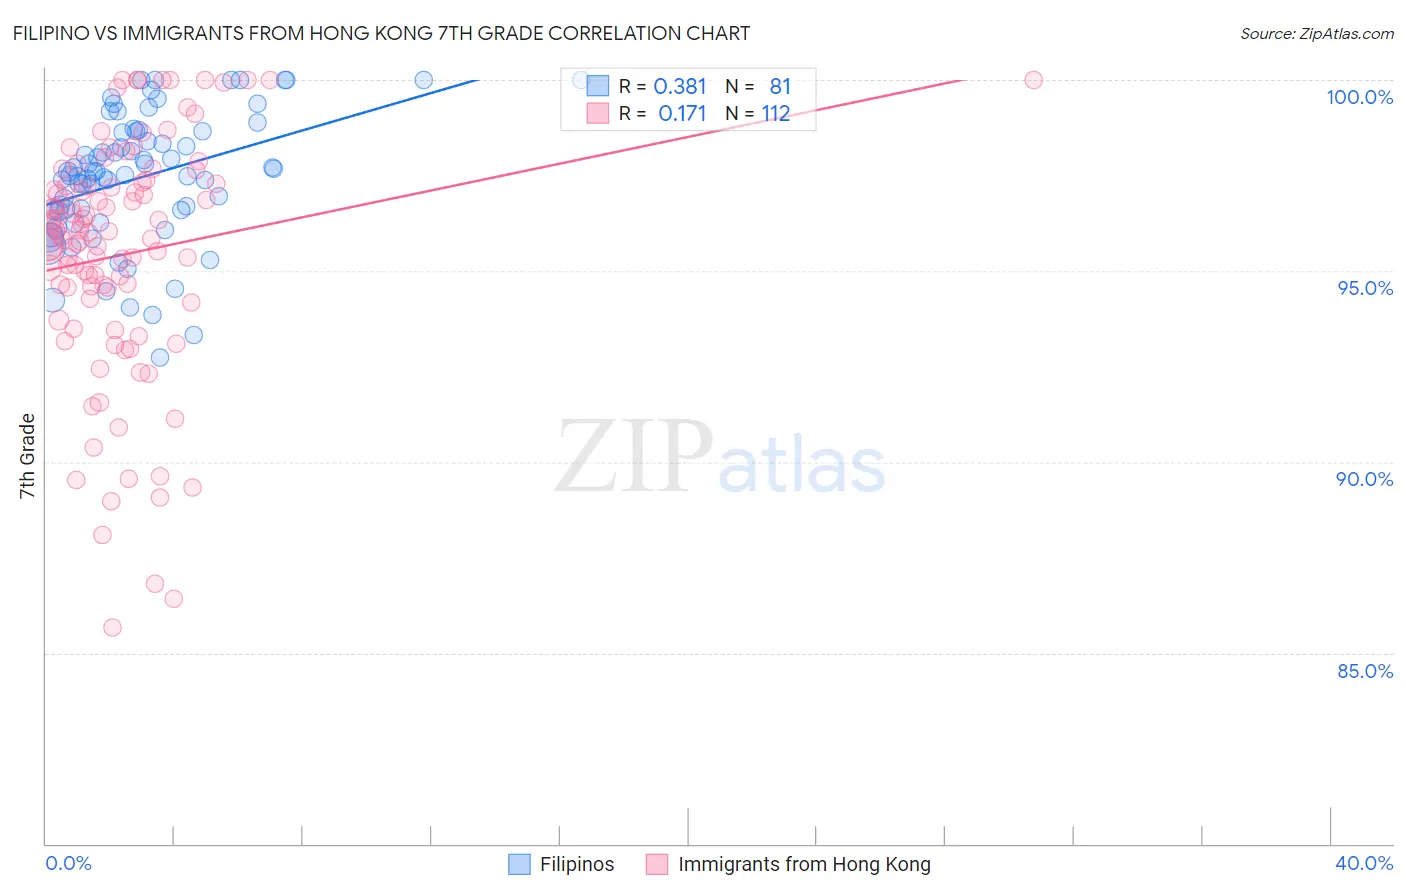
Filipino vs Immigrants from Hong Kong 7th Grade Correlation Chart
The statistical analysis conducted on geographies consisting of 254,351,427 people shows a mild positive correlation between the proportion of Filipinos and percentage of population with at least 7th grade education in the United States with a correlation coefficient (R) of 0.381 and weighted average of 96.4%. Similarly, the statistical analysis conducted on geographies consisting of 253,949,931 people shows a poor positive correlation between the proportion of Immigrants from Hong Kong and percentage of population with at least 7th grade education in the United States with a correlation coefficient (R) of 0.171 and weighted average of 95.2%, a difference of 1.3%.
7th Grade Correlation Summary
| Measurement | Filipino | Immigrants from Hong Kong |
| Minimum | 92.7% | 85.7% |
| Maximum | 100.0% | 100.0% |
| Range | 7.3% | 14.3% |
| Mean | 97.5% | 95.4% |
| Median | 97.6% | 95.9% |
| Interquartile 25% (IQ1) | 96.6% | 94.2% |
| Interquartile 75% (IQ3) | 98.7% | 97.3% |
| Interquartile Range (IQR) | 2.1% | 3.1% |
| Standard Deviation (Sample) | 1.7% | 3.2% |
| Standard Deviation (Population) | 1.7% | 3.1% |
Similar Demographics by 7th Grade
Demographics Similar to Filipinos by 7th Grade
In terms of 7th grade, the demographic groups most similar to Filipinos are Colville (96.4%, a difference of 0.010%), Hmong (96.4%, a difference of 0.010%), Immigrants from Romania (96.4%, a difference of 0.020%), Immigrants from North Macedonia (96.4%, a difference of 0.020%), and Immigrants from Serbia (96.4%, a difference of 0.020%).
| Demographics | Rating | Rank | 7th Grade |
| Immigrants | Switzerland | 94.5 /100 | #124 | Exceptional 96.5% |
| Immigrants | Bulgaria | 94.0 /100 | #125 | Exceptional 96.4% |
| Palestinians | 93.5 /100 | #126 | Exceptional 96.4% |
| Immigrants | Bosnia and Herzegovina | 93.3 /100 | #127 | Exceptional 96.4% |
| Immigrants | Romania | 93.2 /100 | #128 | Exceptional 96.4% |
| Immigrants | North Macedonia | 93.1 /100 | #129 | Exceptional 96.4% |
| Immigrants | Serbia | 92.8 /100 | #130 | Exceptional 96.4% |
| Filipinos | 92.1 /100 | #131 | Exceptional 96.4% |
| Colville | 91.7 /100 | #132 | Exceptional 96.4% |
| Hmong | 91.5 /100 | #133 | Exceptional 96.4% |
| Soviet Union | 91.2 /100 | #134 | Exceptional 96.4% |
| Immigrants | Kuwait | 91.1 /100 | #135 | Exceptional 96.4% |
| Immigrants | Hungary | 90.6 /100 | #136 | Exceptional 96.4% |
| Immigrants | Turkey | 90.2 /100 | #137 | Exceptional 96.4% |
| Jordanians | 90.0 /100 | #138 | Excellent 96.4% |
Demographics Similar to Immigrants from Hong Kong by 7th Grade
In terms of 7th grade, the demographic groups most similar to Immigrants from Hong Kong are Yuman (95.2%, a difference of 0.010%), Immigrants from Uruguay (95.2%, a difference of 0.020%), Immigrants from Ghana (95.2%, a difference of 0.020%), Trinidadian and Tobagonian (95.2%, a difference of 0.020%), and Houma (95.1%, a difference of 0.040%).
| Demographics | Rating | Rank | 7th Grade |
| South Americans | 0.5 /100 | #261 | Tragic 95.2% |
| Immigrants | Somalia | 0.5 /100 | #262 | Tragic 95.2% |
| West Indians | 0.5 /100 | #263 | Tragic 95.2% |
| Immigrants | Nigeria | 0.4 /100 | #264 | Tragic 95.2% |
| Immigrants | Uruguay | 0.3 /100 | #265 | Tragic 95.2% |
| Immigrants | Ghana | 0.3 /100 | #266 | Tragic 95.2% |
| Yuman | 0.3 /100 | #267 | Tragic 95.2% |
| Immigrants | Hong Kong | 0.3 /100 | #268 | Tragic 95.2% |
| Trinidadians and Tobagonians | 0.3 /100 | #269 | Tragic 95.2% |
| Houma | 0.2 /100 | #270 | Tragic 95.1% |
| Immigrants | South America | 0.2 /100 | #271 | Tragic 95.1% |
| Peruvians | 0.2 /100 | #272 | Tragic 95.1% |
| Immigrants | Uzbekistan | 0.2 /100 | #273 | Tragic 95.1% |
| Immigrants | Western Africa | 0.2 /100 | #274 | Tragic 95.1% |
| Immigrants | Colombia | 0.2 /100 | #275 | Tragic 95.1% |