Filipino vs Seminole Single Mother Poverty
COMPARE
Filipino
Seminole
Single Mother Poverty
Single Mother Poverty Comparison
Filipinos
Seminole
24.3%
SINGLE MOTHER POVERTY
100.0/ 100
METRIC RATING
4th/ 347
METRIC RANK
35.8%
SINGLE MOTHER POVERTY
0.0/ 100
METRIC RATING
326th/ 347
METRIC RANK
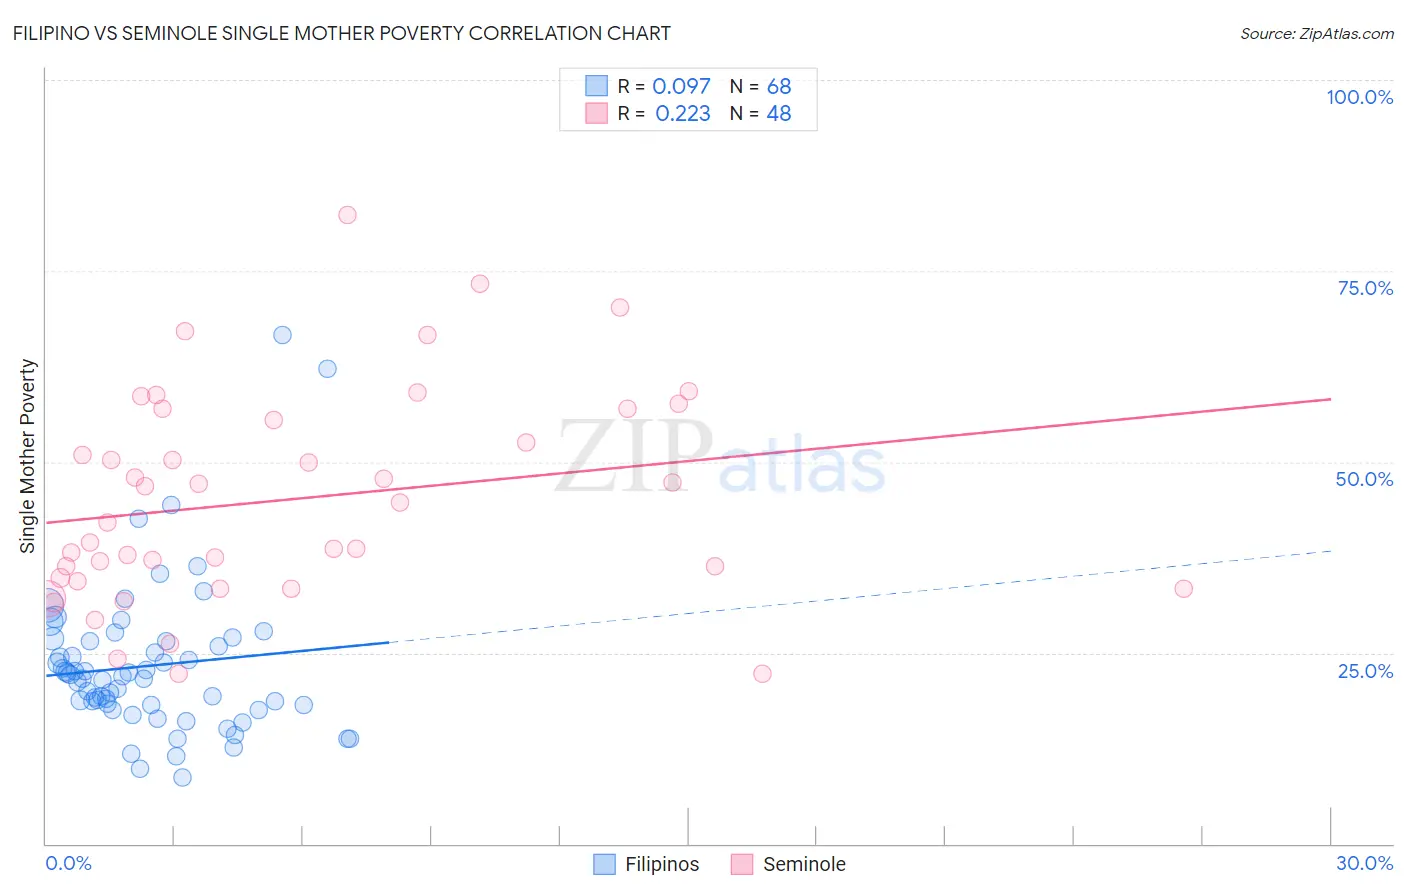
Filipino vs Seminole Single Mother Poverty Correlation Chart
The statistical analysis conducted on geographies consisting of 249,212,409 people shows a slight positive correlation between the proportion of Filipinos and poverty level among single mothers in the United States with a correlation coefficient (R) of 0.097 and weighted average of 24.3%. Similarly, the statistical analysis conducted on geographies consisting of 117,787,190 people shows a weak positive correlation between the proportion of Seminole and poverty level among single mothers in the United States with a correlation coefficient (R) of 0.223 and weighted average of 35.8%, a difference of 47.3%.
Single Mother Poverty Correlation Summary
| Measurement | Filipino | Seminole |
| Minimum | 8.6% | 22.2% |
| Maximum | 66.7% | 82.4% |
| Range | 58.1% | 60.1% |
| Mean | 23.3% | 45.1% |
| Median | 21.8% | 43.4% |
| Interquartile 25% (IQ1) | 18.2% | 34.6% |
| Interquartile 75% (IQ3) | 26.5% | 56.2% |
| Interquartile Range (IQR) | 8.3% | 21.6% |
| Standard Deviation (Sample) | 10.0% | 13.9% |
| Standard Deviation (Population) | 9.9% | 13.8% |
Similar Demographics by Single Mother Poverty
Demographics Similar to Filipinos by Single Mother Poverty
In terms of single mother poverty, the demographic groups most similar to Filipinos are Immigrants from Hong Kong (24.4%, a difference of 0.23%), Thai (24.5%, a difference of 0.72%), Chinese (24.6%, a difference of 1.3%), Immigrants from Taiwan (23.9%, a difference of 1.9%), and Immigrants from India (23.8%, a difference of 2.1%).
| Demographics | Rating | Rank | Single Mother Poverty |
| Assyrians/Chaldeans/Syriacs | 100.0 /100 | #1 | Exceptional 23.8% |
| Immigrants | India | 100.0 /100 | #2 | Exceptional 23.8% |
| Immigrants | Taiwan | 100.0 /100 | #3 | Exceptional 23.9% |
| Filipinos | 100.0 /100 | #4 | Exceptional 24.3% |
| Immigrants | Hong Kong | 100.0 /100 | #5 | Exceptional 24.4% |
| Thais | 100.0 /100 | #6 | Exceptional 24.5% |
| Chinese | 100.0 /100 | #7 | Exceptional 24.6% |
| Immigrants | Iran | 100.0 /100 | #8 | Exceptional 25.1% |
| Immigrants | Lithuania | 100.0 /100 | #9 | Exceptional 25.2% |
| Immigrants | South Central Asia | 100.0 /100 | #10 | Exceptional 25.3% |
| Iranians | 100.0 /100 | #11 | Exceptional 25.5% |
| Bhutanese | 100.0 /100 | #12 | Exceptional 25.6% |
| Indians (Asian) | 100.0 /100 | #13 | Exceptional 25.8% |
| Immigrants | Singapore | 100.0 /100 | #14 | Exceptional 25.8% |
| Immigrants | Ireland | 100.0 /100 | #15 | Exceptional 25.8% |
Demographics Similar to Seminole by Single Mother Poverty
In terms of single mother poverty, the demographic groups most similar to Seminole are Ute (35.7%, a difference of 0.30%), Ottawa (35.5%, a difference of 0.78%), Kiowa (35.5%, a difference of 0.99%), Yakama (36.4%, a difference of 1.6%), and Choctaw (36.4%, a difference of 1.7%).
| Demographics | Rating | Rank | Single Mother Poverty |
| Chippewa | 0.0 /100 | #319 | Tragic 34.8% |
| Iroquois | 0.0 /100 | #320 | Tragic 34.8% |
| Paiute | 0.0 /100 | #321 | Tragic 35.1% |
| Blacks/African Americans | 0.0 /100 | #322 | Tragic 35.2% |
| Kiowa | 0.0 /100 | #323 | Tragic 35.5% |
| Ottawa | 0.0 /100 | #324 | Tragic 35.5% |
| Ute | 0.0 /100 | #325 | Tragic 35.7% |
| Seminole | 0.0 /100 | #326 | Tragic 35.8% |
| Yakama | 0.0 /100 | #327 | Tragic 36.4% |
| Choctaw | 0.0 /100 | #328 | Tragic 36.4% |
| Apache | 0.0 /100 | #329 | Tragic 36.6% |
| Natives/Alaskans | 0.0 /100 | #330 | Tragic 36.6% |
| Creek | 0.0 /100 | #331 | Tragic 36.7% |
| Dutch West Indians | 0.0 /100 | #332 | Tragic 36.8% |
| Menominee | 0.0 /100 | #333 | Tragic 37.1% |