Fijian vs Croatian Family Poverty
COMPARE
Fijian
Croatian
Family Poverty
Family Poverty Comparison
Fijians
Croatians
10.1%
FAMILY POVERTY
2.1/ 100
METRIC RATING
233rd/ 347
METRIC RANK
7.3%
FAMILY POVERTY
99.7/ 100
METRIC RATING
24th/ 347
METRIC RANK
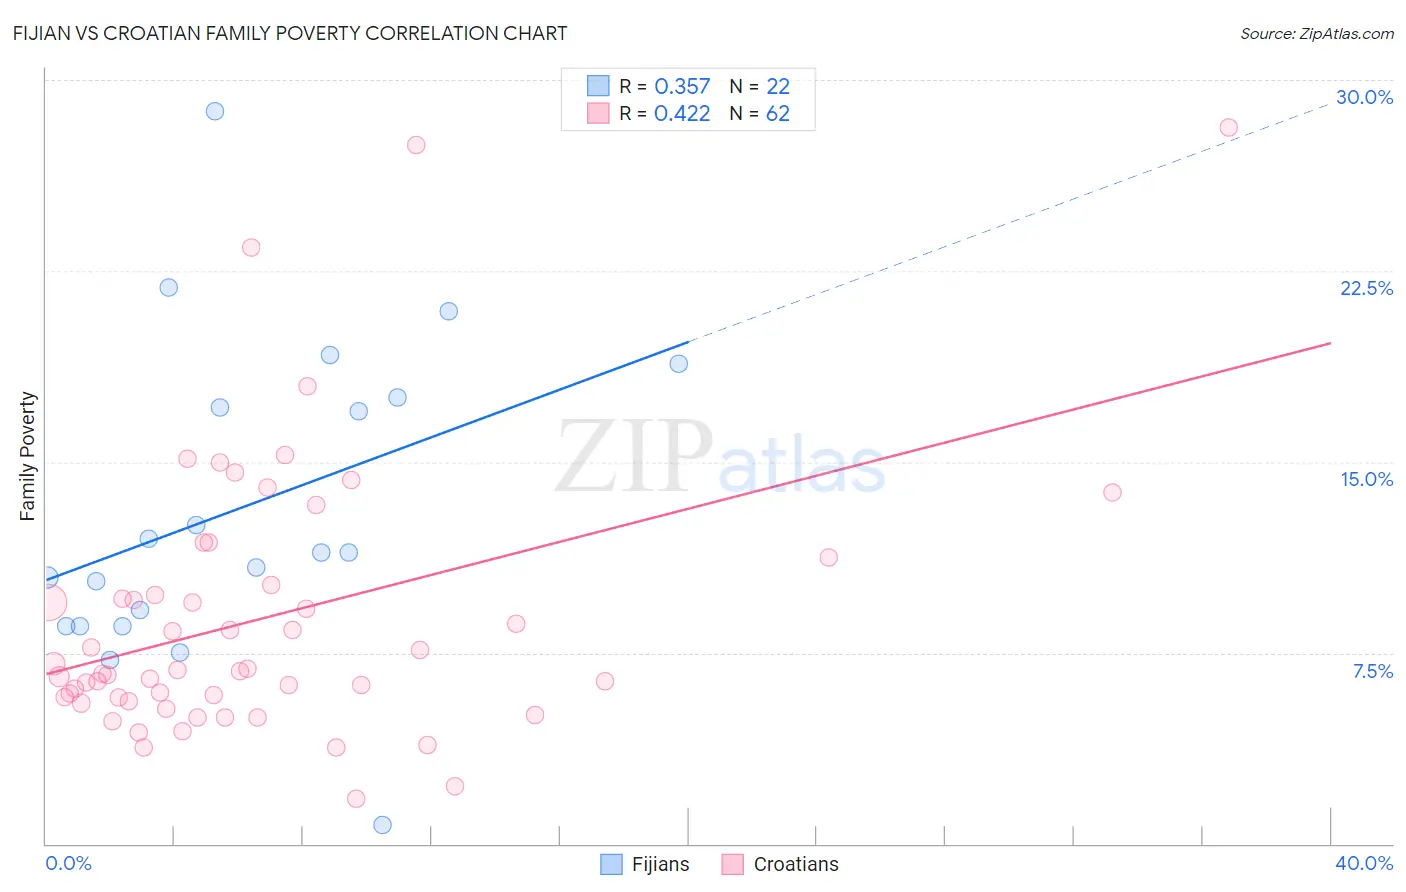
Fijian vs Croatian Family Poverty Correlation Chart
The statistical analysis conducted on geographies consisting of 55,925,682 people shows a mild positive correlation between the proportion of Fijians and poverty level among families in the United States with a correlation coefficient (R) of 0.357 and weighted average of 10.1%. Similarly, the statistical analysis conducted on geographies consisting of 374,582,342 people shows a moderate positive correlation between the proportion of Croatians and poverty level among families in the United States with a correlation coefficient (R) of 0.422 and weighted average of 7.3%, a difference of 38.4%.
Family Poverty Correlation Summary
| Measurement | Fijian | Croatian |
| Minimum | 0.73% | 1.8% |
| Maximum | 28.8% | 28.1% |
| Range | 28.0% | 26.3% |
| Mean | 13.2% | 8.9% |
| Median | 11.4% | 6.8% |
| Interquartile 25% (IQ1) | 8.6% | 5.7% |
| Interquartile 75% (IQ3) | 17.5% | 10.2% |
| Interquartile Range (IQR) | 8.9% | 4.4% |
| Standard Deviation (Sample) | 6.3% | 5.3% |
| Standard Deviation (Population) | 6.1% | 5.3% |
Similar Demographics by Family Poverty
Demographics Similar to Fijians by Family Poverty
In terms of family poverty, the demographic groups most similar to Fijians are Immigrants from Middle Africa (10.1%, a difference of 0.11%), Nigerian (10.1%, a difference of 0.14%), Immigrants from Sudan (10.1%, a difference of 0.25%), Immigrants from Nigeria (10.2%, a difference of 0.39%), and Immigrants from Laos (10.2%, a difference of 0.65%).
| Demographics | Rating | Rank | Family Poverty |
| Ottawa | 3.3 /100 | #226 | Tragic 10.0% |
| Immigrants | Armenia | 3.3 /100 | #227 | Tragic 10.0% |
| Sudanese | 3.1 /100 | #228 | Tragic 10.0% |
| Immigrants | Uzbekistan | 3.1 /100 | #229 | Tragic 10.0% |
| Immigrants | Panama | 3.1 /100 | #230 | Tragic 10.0% |
| Alaskan Athabascans | 2.7 /100 | #231 | Tragic 10.1% |
| Immigrants | Sudan | 2.3 /100 | #232 | Tragic 10.1% |
| Fijians | 2.1 /100 | #233 | Tragic 10.1% |
| Immigrants | Middle Africa | 2.1 /100 | #234 | Tragic 10.1% |
| Nigerians | 2.0 /100 | #235 | Tragic 10.1% |
| Immigrants | Nigeria | 1.9 /100 | #236 | Tragic 10.2% |
| Immigrants | Laos | 1.7 /100 | #237 | Tragic 10.2% |
| French American Indians | 1.5 /100 | #238 | Tragic 10.2% |
| Potawatomi | 1.5 /100 | #239 | Tragic 10.2% |
| Immigrants | Azores | 1.4 /100 | #240 | Tragic 10.3% |
Demographics Similar to Croatians by Family Poverty
In terms of family poverty, the demographic groups most similar to Croatians are Burmese (7.3%, a difference of 0.0%), Cypriot (7.3%, a difference of 0.25%), Immigrants from Scotland (7.3%, a difference of 0.26%), Assyrian/Chaldean/Syriac (7.3%, a difference of 0.30%), and Danish (7.3%, a difference of 0.31%).
| Demographics | Rating | Rank | Family Poverty |
| Luxembourgers | 99.8 /100 | #17 | Exceptional 7.2% |
| Immigrants | Lithuania | 99.8 /100 | #18 | Exceptional 7.2% |
| Eastern Europeans | 99.7 /100 | #19 | Exceptional 7.2% |
| Immigrants | Hong Kong | 99.7 /100 | #20 | Exceptional 7.3% |
| Immigrants | Iran | 99.7 /100 | #21 | Exceptional 7.3% |
| Danes | 99.7 /100 | #22 | Exceptional 7.3% |
| Assyrians/Chaldeans/Syriacs | 99.7 /100 | #23 | Exceptional 7.3% |
| Croatians | 99.7 /100 | #24 | Exceptional 7.3% |
| Burmese | 99.7 /100 | #25 | Exceptional 7.3% |
| Cypriots | 99.6 /100 | #26 | Exceptional 7.3% |
| Immigrants | Scotland | 99.6 /100 | #27 | Exceptional 7.3% |
| Immigrants | Korea | 99.6 /100 | #28 | Exceptional 7.4% |
| Immigrants | Northern Europe | 99.6 /100 | #29 | Exceptional 7.4% |
| Italians | 99.6 /100 | #30 | Exceptional 7.4% |
| Czechs | 99.6 /100 | #31 | Exceptional 7.4% |